- Changes in afterload: EF decreases when afterload increases (aortic stenosis) and increases when it decreases (mitral regurgitation), even in the absence of a change in contractility.
- Changes in preload: EF decreases when end-diastolic volume (Vtd) increases (aortic regurgitation) and increases when it decreases (mitral regurgitation).
- Ventricular size: a large Vtd decreases the EF because its value is in the denominator of the fraction; conversely, if the telesystolic volume tends to zero (hypovolemia, vasoplegia), the EF tends to 1.0 (100%). However, a small LV (mitral stenosis) has a very limited systolic volume, regardless of its contractility.
- Ventricular remodelling: as the ventricle dilates, it becomes spherical; its short-axis/long-axis ratio (normal: 0.5) becomes > 0.7; as they are based on normal ventricular morphology, the echocardiographic formulae used to calculate LV EF are no longer valid when the LV is deformed.
- Wall stress: is proportional to the pressure and radius of the ventricular cavity and inversely proportional to wall thickness; it therefore varies with hypertrophy and increases with ventricular size without a change in EF.
- Ventricular ischaemia: Akinetic, scarred or aneurysmal areas are not taken into account in the geometric approximations used to calculate EF using two-dimensional echocardiography (Teichholz formula). Three-dimensional methods (3D echo, MRI, angio-CT) are more reliable.
In these circumstances, ventricular performance is best assessed by ejection volume, ventricular thickness and size (diameter D and short-axis surface area S) [2,6,7].
- Stroke volume represents the ejection useful for perfusing the body.
- Restricted in stenoses;
- Less than the volume ejected by the ventricle in failure;
- Better assessment than cardiac output, which is compensated by frequency.
- In valvular regurgitation, the best criterion is telesystolic dimension (ts).
- Maximum normal LV diameter (Dts): 4 cm or 2.5 cm/m2;
- Maximum short-axis surface area (Sts): 6.5 cm/m2 .
- In the case of valvular stenosis, the most appropriate criterion is the end-diastolic dimension (td).
- Normal maximum LV dtd: 7 cm or 4 cm/m2 ;
- Maximum short-axis td (TEE): 12 cm/m2 .
- The degree of myocardial hypertrophy.
- Normal thickness of LV (posterior wall) 0.8 - 1.2 cm.
Isovolumetric indices such as ascending mitral regurgitation or Tei (see Chapter 25, Isovolumetric indices) have the advantage of being independent of afterload and ventricular geometry, as they are measured before the aortic or pulmonary valve opens. They remain relevant in the presence of valvular disease [1]. The newer tissue-based measures of myocardial contraction such as longitudinal shortening velocity (S', strain, strain rate) are clearly more effective [4].
Preload and compliance
Preload is the tension on the ventricular wall during telediastole. It is measured by end-diastolic pressure (Ptd) or volume (Vtd). Pressure and volume are linked by the compliance of the ventricular cavity. Preload affects both systolic and diastolic function and is all the more important as these two functions are altered in valvular heart disease.
Increasing venous preload improves systolic performance by following the Frank-Starling curve (Figure 11.15). The curve flattens above a certain value (the knee of the curve), beyond which systolic performance no longer increases with filling. In patients with systolic insufficiency, the curve falls back beyond the knee; this decrease in systolic performance with filling corresponds to excessive LV dilation. In normal ventricular function, there is often an identical decrease in function at very high filling, due to the tilting of the interventricular septum in the LV as a result of right ventricular distension (Bernheim effect) due to overdistension of the circulating volume. This encroachment is responsible for a reduction in LV diastolic volume and explains this apparent reduction in function (Figure 11.16) [5].
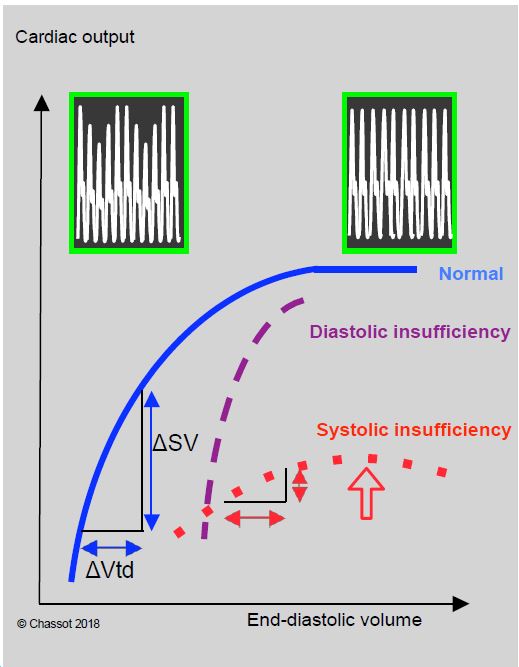
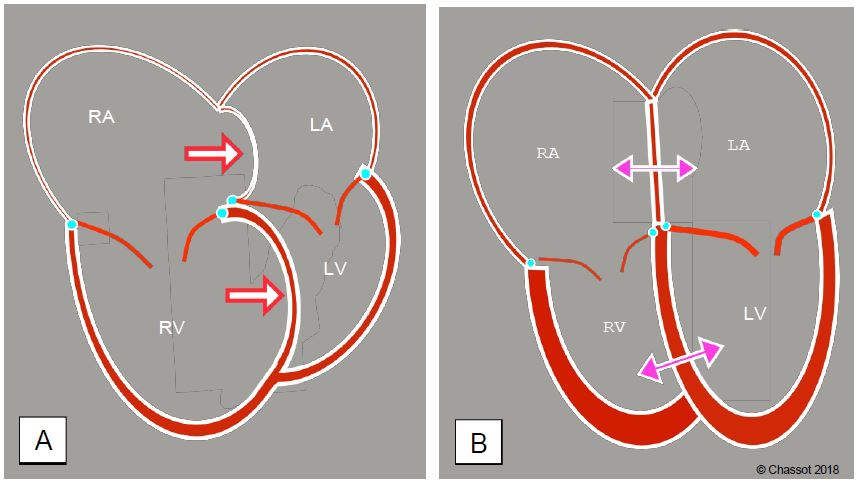
Figure 11.16: Right sided dilation and regurgitation. A: Tilting of the interventricular septum in the left ventricle during pulmonary overload and/or right ventricular failure (Bernheim effect); the primary condition is right-sided dysfunction. Diastolic filling of the LV is impaired and its stroke volume decreases. The interatrial septum bulges into the left atrium. B: Effects on the right cavities of primary LV dysfunction or left heart valve disease. The LV and RA are dilated; left-sided congestion has led to postcapillary pulmonary hypertension (increased right-sided afterload). As a result, the RV is hypertrophied and the RV and RA are dilated. The position of the interatrial septum and the interventricular septum depends on the interaction of right and left pressures in systole and diastole.
Compliance expresses the pressure/volume relationship of a cavity. The ventricular compliance curve is curvilinear. It is almost horizontal at low volumes: variations in filling result in negligible variations in pressure. At high volumes, however, changes in volume are associated with significant changes in pressure because the curve is straightened. A decrease in compliance is typical of diastolic dysfunction: the curve is shifted to the left and upwards, with the same volume corresponding to a higher pressure (Figure 11.17) [3].
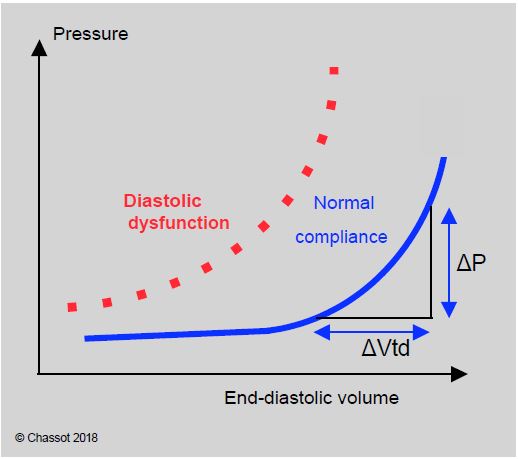
Figure 11.17: The normal compliance curve is very flat at low filling: a large change in volume results in a very small change in pressure. It flattens as the ventricle fills or during diastolic failure. The filling pressures (CVP, PCWP) correctly reflect the preload in hypervolaemia (flattened part of the curve) but not in hypovolaemia (flattened part of the curve).
Superimposition of the compliance and Frank-Starling curves shows that preload significantly modifies systolic performance when ventricular volume is low (left ascending part of the Starling curve), resulting in a significant variation in arterial pressure with mechanical ventilation, typical of hypovolemia. At high filling, variations in preload no longer affect systolic ejection, but the compliance curve is very steep: variations in volume (Vtd) are reflected in large variations in diastolic pressure (CVP and PCWP). The way in which blood volume is assessed therefore varies according to the degree of filling.
- In hypovolaemia, ventilatory changes in systolic ejection (ΔPAsystolic, ΔVS) and interatrial septum (TEE) are the best indicators; CVP and PCWP are little influenced by filling changes.
- In hypervolaemia, variations in right atrial pressure (RAP) or pulmonary artery occlusion pressure (PCWP) are very reliable for assessing the degree of filling.
Valvular disease leads to hypertrophic changes (stenosis) or dilatation (regurgitation) and alters the relationship between ventricular function and preload in two ways.
- The systolic dysfunction characteristic of dilatation is reflected in a flattening of the Starling curve; systolic performance becomes insensitive to variations in preload; filling does not improve cardiac output.
- The diastolic dysfunction typical of ventricular hypertrophy (thick, rigid wall) is characterised by a very vertical pressure-volume relationship. Systolic volume is highly dependent on preload and filling pressure is increased for the same volume; tolerance to hypovolemia is extremely limited. When the ventricle is dilated, it presses against the pericardium in diastole; this external constraint imposes a restriction on filling of the same type as in tamponade.
The thickening of the ventricular wall in hypertrophic remodelling makes it rigid and noncompliant. Diastolic function is reduced due to lack of active protodiastolic relaxation and lack of end-diastolic distensibility. Filling pressures are high; the patient may be hypovolemic with normal CVP and PCWP. Ventricular filling is all the more dependent on atrial contraction as protodiastolic relaxation is reduced; in this case, active filling (wave A of mitral flow) contributes 40-50% of LV end-diastolic volume. Concentric left ventricular hypertrophy (LVH) increases the risk of ischaemia (see Adaptation to valvular disease).
- The same pathology affects the right and left valves (ARF, endocarditis, myxoid degeneration, etc.) or both ventricles (infectious, toxic, degenerative cardiomyopathy, etc.).
- Left-sided congestion (mitral disease, LV failure) induces postcapillary pulmonary hypertension, which is subsequently accompanied by precapillary pulmonary hypertension due to secondary arterial vasoconstriction (see Pulmonary hypertension). Pulmonary arterial hypertension (PAH) increases the afterload on the RV, which dilates, hypertrophies and then fails. The degree of tricuspid regurgitation reflects the degree of dilatation of the tricuspid annulus.
| Ventricular Function and heart valve disease |
|
Systolic function in valvular disease
- FE irrelevant due to remodelling and altered loading conditions
- Telediastolic (td) and telesystolic (ts) dimensions are the best criteria.
- In failure: LV telesystolic diameter (maximum normal: 2.5 cm/cm2)
- In stenosis: LV end-diastolic diameter (maximum normal: 4 cm/cm2)
- LVH: posterior wall thickness > 1.2 cm
Diastolic function
- Dysfunction due to ventricular hypertrophy and/or dilatation
- Cardiac output becomes dependent on preload and rate
Concentric LVH
- Preserved systolic function but diastolic dysfunction
- Risk of myocardial ischaemia
All valvulopathies have a very low tolerance to hypovolemia, so preload must preferably remain high.
|
© CHASSOT PG, BETTEX D, August 2011, last update November 2019
References
- BETTEX D, CHASSOT PG. Transoesophageal echocardiography in anaesthesia and intensive care. Paris: Masson, Williams & Wilkins, 1997, 454 pp.
- BORROW K, GREEN LH, MANN T, et al. End-systolic volume as a predictor of postoperative left ventricular performance in volume overload from valvular regurgitation. Am J Med 1980; 68:655-60.
- HAYASHIDA W, KUMATA T, KOHNO F, et al. Left ventricular regional relaxation and its non-uniformity in hypertrophic non-obstructive cardiomyopathy. Circulation 1991; 84:1496-2003
- KEMPNY A, DILLER GP, KALESCHKE G, et al. Longitudinal left ventricular 2D strain is superior to ejection fraction in predicting myocardial recovery and symptomatic improvement after aortic valve implantation . Int J Cardiol 2013; 167:2239-43
- MOORE TD, Frenneaux MP, Rozsa Sas JJ, et al. Ventricular interaction and external constraint account for decreased stroke work during volume loading in CHF. Am J Physiol 2001; 281:H2385-H2391
- NISHIMURA RA, OTTO CM, BONOW RO, et al. 2014 AHA/ACC Guideline for the management of patients with valvular heart disease. Circulation 2014; 129:e521-e643
- OH JK, SEWARD JB, TAJIK AJ. The echo manual. 3rd edition. Philadelphia, Lippincott Williams & Wilkins, 2006, 189-242
- ROBOTHAM JL, TAKATA M, BERMAN M, et al. Ejection fraction revisited. Anesthesiology 1991; 74:172-83.