As the severity of symptoms is not directly related to the severity of stenosis, the values obtained from the various cardiological tests must always be interpreted in their clinical context. Transthoracic or transesophageal echocardiography is the technique of choice, as it allows non-invasive measurement of aortic valve area and gradient, assessment of ventricular function, and investigation of associated valvular disease. If there is no need to examine the coronary arteries, catheterisation is not performed: echocardiographic data are sufficient in 85% of cases [25]. However, coronary angiography is still indicated in cases of ischaemic symptoms and in men over 45 years of age or postmenopausal women undergoing aortic valve replacement (AVR) on ECC.
- The advantage of multi-slice CT is that it highlights calcified areas and calculates an index of the degree of calcification, making it possible to quantify the calcium burden on the aortic valve in degenerative stenosis. Valve calcium burden (calcium score ≥ 1,600) is an independent predictor of perioperative mortality (HR 1.71) [7]. Its excellent spatial resolution makes it ideal for the measurements required for percutaneous valve implantation (TAVI). Angio-CT visualises the coronary arteries with sufficient accuracy to exclude ischaemic disease, but coronary angiography is still required in the case of a positive image.
- MRI is invaluable for assessing tissue structure, particularly the presence of fibrosis within myocardial hypertrophy (late gadolinium enhancement), which may explain poor ventricular performance despite preserved ejection fraction [3]. However, it cannot assess calcification and its spatial resolution is inferior to that of CT.
2D/3D Exam
2D/3D TEE directly visualises the valve in its short axis ("front" view at 40°) and in its long axis ("side" view at 120°). A number of observations can be made.
- Number of cusps; normally tricuspid, the aortic valve is bicuspid in 1-2% of the population; in almost three quarters of cases the right and left cusps are fused by a raphe, and opening occurs between this large anterior valve and the posterior non-coronary cusp (see Aortic bicuspidity) [32].
- Size of the valve and the aortic ring; the latter is a virtual structure corresponding to the implantation base of the cusps (see Figure 11.8) [36].
- Outflow tract diameter; several different measurements are essential for sizing a prosthesis and performing a prosthetic or transcatheter (TAVI) implantation (see Figure 11.11).
- Left ventricular outflow tract (LVOT), measured just below the valve between the septum and the base of the anterior mitral leaflet;
- Aortic ring diameter;
- Diameter of the sinuses of Valsalva;
- Distance between the free edges of the cusps;
- Diameter of the sinotubular junction.
- Degree of opening in systole; the size of the orifice gives an idea of the degree of stenosis (mild, moderate or severe). Quantification by planimetry has the advantage of being a measure independent of haemodynamics, but is questionable (see below).
- Degenerative calcific disease: in the body and at the base of the leaflets;
- Rheumatic fever: at the commissures (commissural fusion);
- Bicuspidity: predominant in the raphe.
Video: long-axis view of a tight aortic valve stenosis; the cusps practically stand still; the calcifications of the aortic root form shadow cones.
Video: short-axis view of a tight aortic valve stenosis; the right and non-coronary cusps are blocked by calcium deposits; only the left cusp allows a small opening in systole.
- Size of the ascending aorta; dilatation is often associated with biscuspidation.
- Presence of a septal spur at the root of the LVOT, which may be surgically resected to limit the risk of dynamic subaortic obstruction after AVR. The thickness of the septum is measured at the level of the spur and at the level of the adjacent septum to allow the surgeon to estimate the depth of resection possible without risk of iatrogenic VSD (see Figure 13.14).
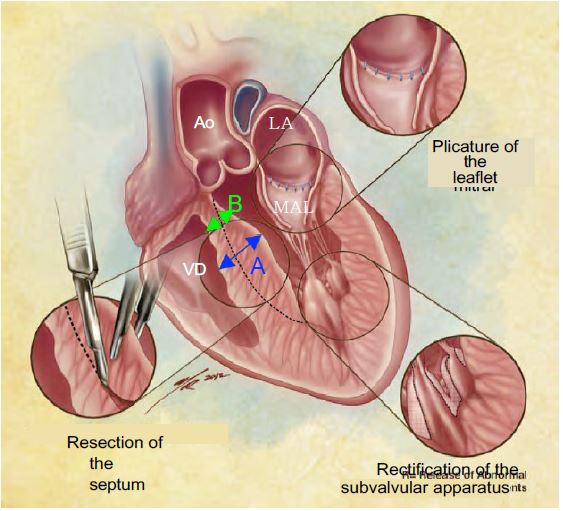
Figure 13.14: Intra-operative transesophageal echocardiography should determine the thickness of the septum at two points before ECC: at the level of the spur where it is thickest (A, in blue) and in the subaortic zone where it is thinnest (B, in green). This second measurement is essential for the surgeon to avoid too deep a resection with the risk of iatrogenic VSD; it is also important to indicate the distance between the aortic annulus and the maximum bulge [According to: Swistel DG & Balaram SK. Surgical myectomy for hypertrophic cardiomyopathy in the 21st century, the evolution of the "RPR" repair: resection, plication and release. Progr Cardiovasc Dis 2012; 54:498-502] .
The 2D examination is not complete without an assessment of the size of the LA and LV, the extent of concentric hypertrophy (posterior wall thickness > 1.2 cm) and ventricular function.
Velocity across the aortic valve
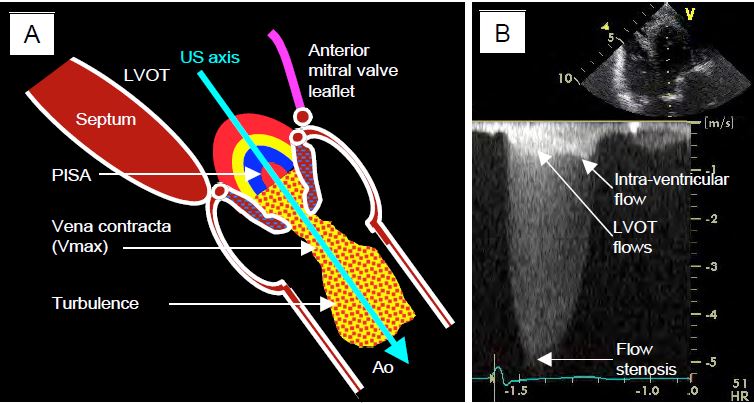
Flow across the stenosis is measured by transgastric Doppler, which is the only way to align with the aortic valve on TEE: deep transgastric view at 0° and long-axis transgastric view at 120° (Figures 11.112 and 11.113) [33]. For the value to be correct, the axis of the Doppler interrogation must be identical to that of the aortic flow where it is fastest, i.e. just downstream of the stenosis (vena contracta, see Valve echocardiography). This can be difficult with the transgastric approach because the transducer positions are limited by the mechanics of the probe and because the Doppler beam has to pass through the valve to sample the flow at its outlet in the root of the aorta [15]. However, the valve is highly deformed and its axis can be misaligned. If the alignment is correct, the coloured flow shows a zone of concentric acceleration (PISA) upstream of the valve, a constricted flow through the orifice, a vena contracta just downstream and a swirling zone in the ascending aorta (Figure 11.114). The more the Doppler axis is out of phase with the flow, the lower the measured velocity and the more the gradient will be underestimated.
Video: 120° long-axis transgastric view of a tight aortic stenosis; there is a zone of concentric acceleration on the ventricular side (PISA); presence of a minimal insufficiency. The direction of flow is well within the ultrasound axis and allows Vmax to be recorded accurately.
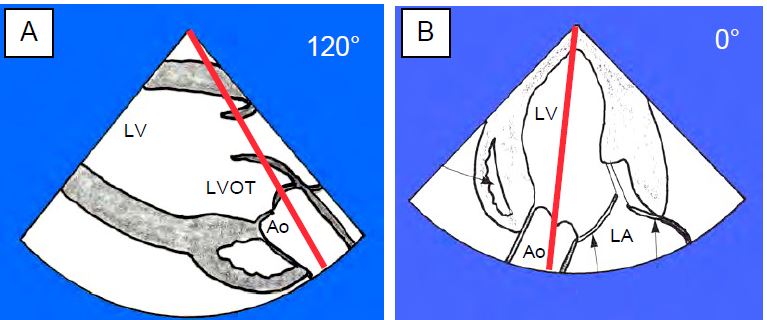
Figure 11.112: Aortic flow on TEE. A: Positioning of the Doppler axis in the 120° long-axis transgastric view. B: Positioning in the 0° deep transgastric view [6].
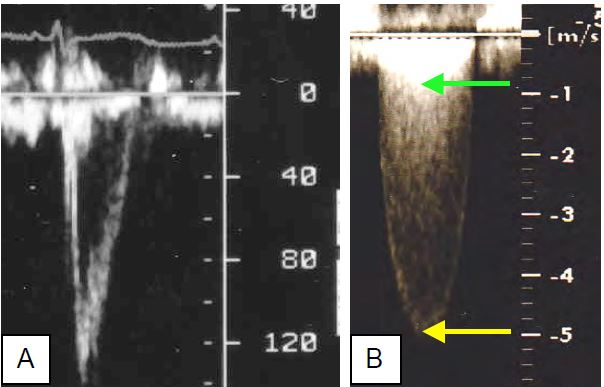
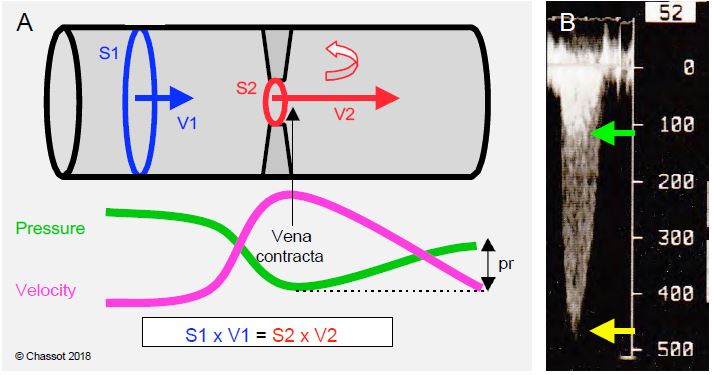
Figure 11.113: Aortic flow. A: Spectral aspect of pulsed Doppler flow in the Chasse chamber, 3-5 mm upstream of the aortic valve (Vmax 140 cm/s); the sensor must be in the middle of the flow. B: Spectral aspect of continuous Doppler in a tight aortic stenosis; the Vmax (5 m/s) represents the velocity through the valve (yellow arrow); the superimposed image (double contour) at approximately 0.8 m/s is the velocity through the LVOT (green arrow).
- Peak-to-peak gradient (catheterisation): difference between the maximum ventricular and aortic pressures; these two pressures are not simultaneous; this gradient does not really exist in nature.
- Maximum gradient (echo): pressure difference calculated at the highest transvalvular velocity occurring during the acceleration of the flow at the beginning of systole (maximum instantaneous gradient); it corresponds to the velocity in the vena contracta, which is the zone of maximum contraction of the flow just downstream of the minimal anatomical section of the stenosis. The area of the vena contracta (haemodynamically effective area) is slightly smaller than the area of the stenosis (geometric area).
- Mean gradient (echo): average of the sum of the instantaneous gradients; the mean gradient is a better estimate of the degree of obstruction because it is less dependent on haemodynamic conditions and less prone to overestimating the stenosis.
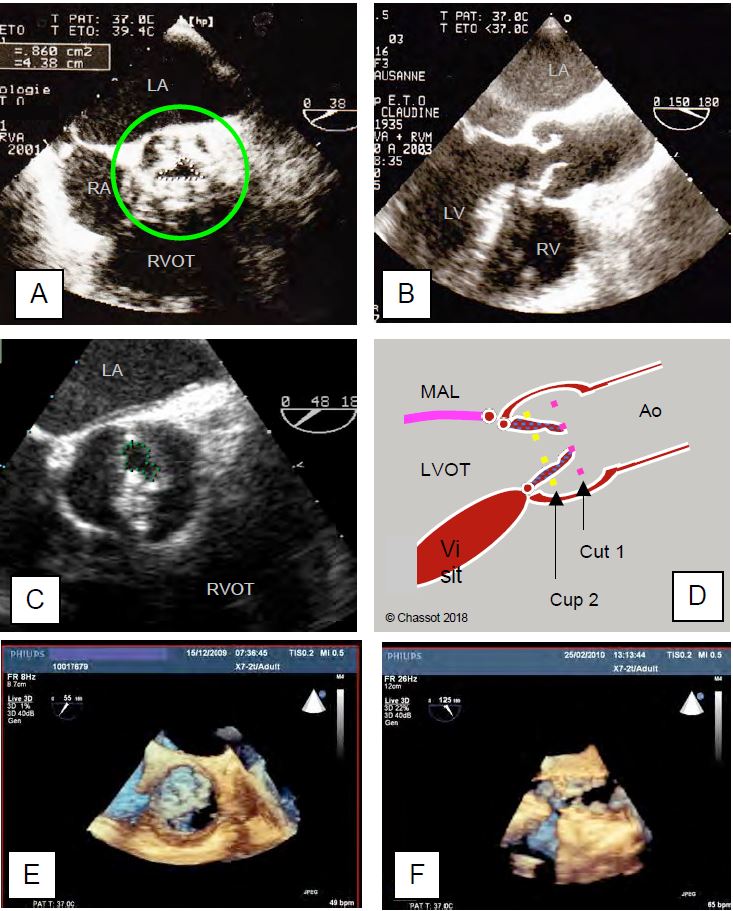
- Large calcifications create very strong echoes that saturate the image and shadow areas that obscure more distant structures; the perimeter of the orifice can be very difficult to draw accurately.
Video: Tight aortic stenosis of a tricuspid valve in 50° short-axis view. Although difficult, planimetry is feasible.
Video: 30° short-axis view of a tight calcified aortic stenosis with virtually motionless cusps. Planimetry is impossible here.
- The valve may be so deformed that the echocardiographic short axis is not perpendicular to the axis of the tortuous canal between the calcifications.
- The valve has the shape of a cone that dips into the aortic root; the appropriate section plane passes through the narrowest point, which is usually the most distal, but it cannot be excluded that the section plane is not further upstream and that the size of the orifice is significantly overestimated. 3D reconstruction provides greater accuracy and shows that 2D planimetry tends to overestimate the actual opening area [9].
Video: 130° long-axis view of a tight calcified aortic stenosis; the cusps hardly open at all.
Video: Three-dimensional view of a tight aortic stenosis, with only one cusp moving in systole.
.
Ventricular failure (EF < 0.50) can reduce the mean gradient to < 30 mmHg if the valve area is less than 1.0 cm2 (low flow/low gradient). However, low ventricular ejection may also mean that a simply sclerosed aortic valve cannot open properly, giving the impression that the opening is smaller than it actually is (pseudostenosis). A dobutamine stress echo (dose < 10 mcg/kg/min) can be used to differentiate between these two situations (Figure 11.118) [3,28]. In narrow aortic stenosis, Vmax and pressure gradient increase with dobutamine (≥ 4 m/s and > 30-40 mmHg, respectively), but not the valve area, which remains fixed due to calcifications. In cardiomyopathy, however, the measured valve area increases because improved LV function allows stroke volume to increase and the valve to open further, but the gradient does not change [21,27,28,30]. The ratio between the velocity in the LVOT ( VTILVOT ) and the velocity across the aortic valve ( VTIVao ) is < 0.25 in narrow aortic stenosis (normal: > 0.8). With dobutamine, this ratio increases further in tight stenosis because VTIVao increases more than VTILVOT. In cardiomyopathy and functional stenosis, however, the ratio increases because the acceleration in the LVOT is much greater than through the valve, which increases its opening and adapts to the increase in stroke volume without changing its gradient [8].
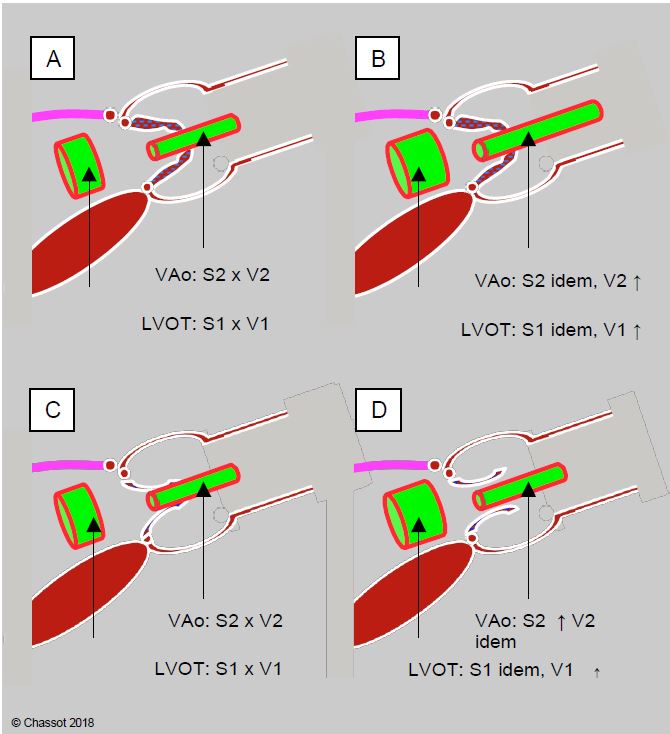
Figure 11.118: Dobutamine stress echo to differentiate fixed aortic stenosis (top) from functional stenosis (bottom) in the presence of ventricular dysfunction and low gradient. A: The transvalvular gradient is low despite a tight, highly calcified stenosis on planimetry. B: In a tight aortic stenosis, the pressure gradient on dobutamine increases by >18 mmHg, but not the valve surface, which remains fixed due to calcification. C: The transvalvular gradient is low despite a tight stenosis on planimetry, but the valve is simply sclerosed and the LV is unable to open it properly. D: in the case of cardiomyopathy, the measured valve area increases because the functional improvement in the LV allows the stroke volume to increase and the valve to open further; Vmax remains unchanged. In both cases, the surface area of the LVOT does not change, but its velocity increases. LVOT: LV outflow tract.
A pressure rise of <20 mmHg and an ejection volume of <20% during the dobutamine test are associated with a poor prognosis [2]. This inadequate inotropic response stigmatises irreversible ventricular failure, which increases the mortality of surgical intervention to 20-30% [20]. Stress echocardiography is also useful in unmasking symptoms in patients with tight stenosis who are asymptomatic or hide their condition by limiting their activity. However, it is contraindicated in symptomatic patients with a high gradient [35].
A paradoxical situation of low gradient (ΔPmoy < 40 mmHg) and tight stenosis (S < 1.0 cm2 ) can sometimes occur in the presence of normal ventricular function (EF > 50%). These are usually elderly patients with concentric hypertrophy, a particularly restrictive ventricular cavity and a stroke volume < 35 mL/m2 [28]. However, more detailed investigations, such as measurement of LV longitudinal shortening (strain and strain rate), actually show deterioration in contractile function and advanced fibrosis [1,18].
A positive stress test response is a good indication for surgery, as removal of the obstruction improves LV performance; an increase in stroke volume of >20% suggests a contractile reserve favourable to surgery [4]. In the case of pseudostenosis, the benefit of AVR is likely to be negligible compared with the risk, although some patients may improve [11]. In the former, the one-year mortality is less than 15%, whereas in the latter it is more than doubled [22]. In these high-risk circumstances, a minimally invasive technique such as TAVI is preferable.
These various discrepancies between gradient, velocity and area occur in 30% of cases of tight aortic stenosis [26]. What should the echocardiographer do when faced with this problem [4]?
- Check for simple measurement errors: Doppler axis misalignment, LVOT diameter measurement error. Adolescents and short people have smaller aortic valves, so it is advisable to index the valve surface area to the body surface area.
- Ensure good haemodynamic stability during the examination. Variations in stroke volume alter the velocity and gradient across the aortic valve.
- High flow: sympathetic stimulation, anaemia, fever, arteriovenous shunt (dialysis), vasodilatation, IABP; in these circumstances Vmax in the LVOT is excessive.
- Reduced flow: hypovolemia, hypertension, myocardial depression (anaesthesia).
- Look for associated pathologies: aortic insufficiency (high SV), mitral insufficiency (transfer of part of the SV to the mitral valve), mitral stenosis (low SV), severe arterial hypertension (reduced gradient). On Doppler, the jet of a severe MI can be confused with that of aortic stenosis, although their morphology is different.
- Perform a stress echo in a low-flow/low-gradient situation with an apparently narrow stenosis.
- Differentiate between true stenosis with LV dysfunction (indication for AVR) and pseudostenosis (doubtful indication).
- Differentiation between positive functional reserve (indication for AVR) and absence of functional reserve (high mortality, preference for TAVI).
- Complement echocardiography with an additional test.
- 3D echo: planimetry of aortic valve orifice, planimetry of LVOT.
- CT scan: precise measurement of LVCC, calcium index.
- MRI: myocardial function, fibrosis.
- Evaluate the factors that favour AVR, even in an asymptomatic patient.
- Vmax ≥ 5 m/s.
- Massive calcification.
- Mean pressure gradient increased > 20 mmHg with dobutamine.
The anaesthetist may be faced with this type of assessment in the operating theatre during coronary artery bypass grafting (CABG) or polyvalvulopathy and the discovery of unexpected or greater than expected aortic stenosis. This occurs in 2.3% of coronary artery bypass graft (CABG) operations [23]. The mortality rate in CABG is directly proportional to the degree of stenosis: it increases 2.5-fold when the aortic surface area is 1.0-1.25 cm2 [24], and spontaneous progression to tight stenosis is faster the older the patient [19]. Therefore, concomitant AVR is recommended for moderate to severe or severe stenosis [4,28].
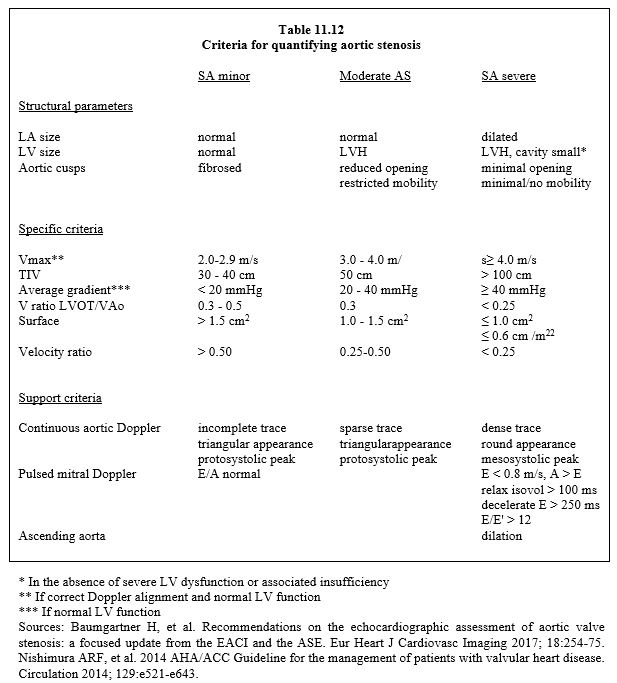
| Echocardiography in aortic stenosis |
| Two-dimensional features of severe AS :
- Low cusp mobility Colour Doppler (narrow stenosis) : Continuity equation: S = (SLVOT · VTILVOT ) / VTIVao Pressure gradient: ΔP= 4 (V2VAo - V2LVOT) - Vmax > 4 m/s, VTI ≥ 100 cm, ratio VTILVOT / VTIVao ≤ 0.25 - ΔPmoy- ≥ 40 mmHg Tight aortic stenosis with low pressure gradient in LV dysfunction is an indication for a dobutamine stress test: |
References
- ADDA J, MIELOT C, GIORGI R, et al. Low flow/low gradient severe aortic stenosis despite normal ejection fraction is associated with severe left ventricular dysfunction as assessed by speckle-tracking echocardiography: a multicenter study. Circ Cardiovasc Imaging 2012; 5:27-35
- AMATO MC, MOFFA PJ, WERNER KE, et al. Treatment decision in asymptomatic aortic valve stenosis: role of exercise testing. Heart 2001; 86:381-6
- BAUMGARTNER H, FALK V, BAX JJ, et al. 2017 ESC/EACTS Guidelines for the management of valvular heart disease. Eur Heart J 2017; 38:2739-86
- BAUMGARTNER H, HUNG J, BERMEJO J, et al. Recommendations on the echocardiographic assessment of aortic valve stenosis: a focused update from the EACI and the ASE. Eur Heart J Cardiovasc Imaging 2017; 18:254-75
- BAX JJ, DELGADO V. Advanced imaging in valvular heart disease. Nat Rev Cardiol 2017; 14:209-23
- BETTEX D, CHASSOT PG. Echocardiographie transoesophagienne en anesthésie-réanimation. Paris: Masson, Williams & Wilkins, 1997, 454 pp
- CLAVEL MA, PIBAROT P, MESSIKA-ZEITOUN D, et al. Impact of aortic valve calcification as measured by MDCT, on survival in patients with aortic stenosis; results of an international registry study. J Am Coll Cardiol 2014; 64:1202-13
- DEFILIPPI CR, WILLETT DL, BRICKNER ME, et al. Usefullness of dobutamine echocardiography in distinguishing severe from nonsevere valvular aortic stenosis in patients with depressed left ventricular function and low transvalvular gradients. Am J Cardiol 1995; 75:191-4
- DE LA MORENA G, SAURA D, OLIVA MJ, et al. Real-time three-dimensional transoesophageal echocardiography in the assessment of aortic valve stenosis. Eur J Echocardiogr 2010; 11:9-13
- FEISSEL M, MICHARD F, MANGIN I, et al. Respiratory changes in aortic blood velocity as an indicator of fluid responsiveness in ventilated patients with septic shock. Chest 2001; 119:867-73
- FOUGERES E, TRIBOUILLOY C, MONCHI M, et al. Outcomes of pseudo-severe aortic stenosis under conservative treatment. Eur Heart J 2012; 33:2426-33
- GASPAR T, ADAWI S, SACHNER R, et al. Three-dimensional imaging of the left ventricular outflow tract: impact on aortic valve area estimation by the continuity equation. J Am Soc Echocardiogr 2012; 25:749-57
- GORLIN R, GORLIN SG. Hydraulic formula for calculation of the area of the stenotic mitral valve, other cardiac valves, and the central circulatory shunts. I. Am Heart J 1951; 41:1-29
- HACHICHA Z, DUMESNIL JG, PIBAROT P. Usefulness of the valvuloarterial impedance to predict adverse outcome in asymptomatic aortic stenosis. J Am Coll Cardiol 2009; 54:1003-11
- HILBERATH JN, SHERNAN SK, SEGAL S, et al. The feasibility of epicardial echocardiography for measuring aortic valve area by the continuity equation. Anesth Analg 2009; 108:17-22
- HOFFMANN R, FLASCHKAMPF FA, HANRATH P. Planimetry of orifice area in aortic stenosis using multiplane transesophageal echocardiography. J Am Coll Cardiol 1993; 22:529-34
- JAINANDUNSING JS, MAHMOOD F, MAYTAL R, et al. Impact of three-dimensional echocardiography on classification of the severity of aortic stenosis. Ann Thorac Surg 2013; 96:1343-8
- KEMPNY A, DILLER GP, KALESCHKE G, et al. Longitudinal left ventricular 2D strain is superior to ejection fraction in predicting myocardial recovery and symptomatic improvement after aortic valve implantation . Int J Cardiol 2013; 167:2239-43
- KUME T, KAWAMOTO T, OKURA H, et al. Rapide progression of mild to moderate aortic stenosis in patients older than 80 years. J Am Soc Echocardiogr 2007; 20:1243-6
- LANCELLOTTI P, LEBOIS F, SIMON M, et al. Prognostic importance of quantitative exercise Doppler echocardiography in asymptomatic aortic valvular stenosis. Circulation 2005; 112 Suppl I:I1377-82
- LASKEY WK, KUSSMAUL WG, NOORDEGRAAF A. Systemic arterial response to exercise in patients with aortic valve stenosis. Circulation 2009, 119:996-1004
- LAUTEN A, ZAHN R, HORACK M, et al. Transcatheter aortic valve implantation in patients with low-flow, low-gradient aortic stenosis. JACC Interv 2012; 5:552-9
- MAHMOOD F, FRITSCH M, MASLOW A. Unanticipated mild-to moderate aortic stenosis during coronary artery bypass graft surgery: scope of the problem and its echocardiographic evaluation. J Cardiothorac Vasc Anesth 2009; 23:869:77
- MALDONADO Y, SINGH S, AUGOUSTIDES JG, et al. Moderate aortic stenosis and coronary artery bypass grafting: clinical update for the perioperative echocardiographer. J Cardiothorac Vasc Anesth 2015; 29:1384-90
- MILLER FA. Aortic stenosis: Most cases no longer require invasive hemodynamic study. J Am Coll Cardiol 1989; 13:551-8
- MINNERS J, ALLGEIER M, GOHLKE-BAERWOLF C, et al. Incosistent grading of aortic valve stenosis by current guidelines: haemodynamic studies in patients with apparently normal left ventricular function. Heart 2010; 96:1463-8
- MONIN JL, QUERE JP, MONCHI M, et al. Low-gradient aortic stenosis: Operative risk stratification and predictors for long-term outcome – A multicenter study using dobutamine stress hemodynamics. Circulation 2003; 108:319-26
- NISHIMURA RA, OTTO CM, BONOW RO, et al. 2014 AHA/ACC Guideline for the management of patients with valvular heart disease. Circulation 2014; 129:e521-e643
- O'BRIAN B, et al. Integration of 3D imaging data in the assessment of aortic stenosis: impact on classification of disease severity. Circ Cardiovasc Imaging 2011; 4:566-73
- 30 PIERARD LA, LANCELLOTTI P. Stress testing in valve disease. Heart 2007; 93:766-72
- 31 SAIKRISHNAN N, KUMAR G, SAWAYA FJ, et al. Accurate assessment of aortic stenosis: a review of diagnostic modalities and hemodynamics. Circulation 2014; 129:244-53
- 32 SIEVERS HH, SCHMIDTKE C. A classification system for the bicuspid aortic valve from 304 surgical specimens. J Thorac Cardiovasc Surg 2007; 133:1228-33
- 33 STODDARD MF, HAMMONS RT, LONGAKER RA. Doppler transesophageal echocardiographic determination of aortic valve area in adult with aortic stenosis. Am Heart J 1996; 132:337-42
- 34 UDA Y, COWIE B, KLUGER R. Comparison of preoperative and intraoperative assessment of aortic stenosis severity by echocardiography. Br J Anaesth 2017; 118:699-704
- 35 VAHANIAN A, ALFIERI O, ANDREOTTI F, et al. Guidelines on the management of valvular heart disease (version 2012). The Joint Task Force on the Management of Valvular Heart Disease of the European Society of Cardiology (ESC) and the European Association for Cardio-Thoracic Surgery (EACTS). Eur Heart J 2012; 33:2451-96
- 36 ZAMORANO JL, BADANO LP, BRUCE C, et al. EAE/ASE recommendations for the use of echocardiography in new transcatheter interventions for valvular heart disease. Eur J Echocardiogr 2011; 12:557-84
- 37 ZOGHBI WA, ADAMS D, BONOW RO, et al. Recommendations for noninvasive evaluation of native valvular regurgitation: a report from the ASE developed in collaboration with the SCMR. J Am Soc Echocardiogr 2017; 30:303-71
- 38 ZOGHBI WA, CHAMBERS JB, DUMESNIL JG, et al. Recommendations for evaluation of prosthetic valves with echocardiography and Doppler ultrasound. J Am Soc Echocradiogr 2009; 22:975-1014