In this chapter, intraoperative transesophageal echocardiography (TEE) will be used extensively to illustrate valve pathology and surgical outcomes. Therefore, it is useful to begin with an overview of two-dimensional imaging and Doppler echocardiography. TEE of valvulopathy is discussed in more detail in Chapter 26 (TEE 2nd part).
Mitral valve
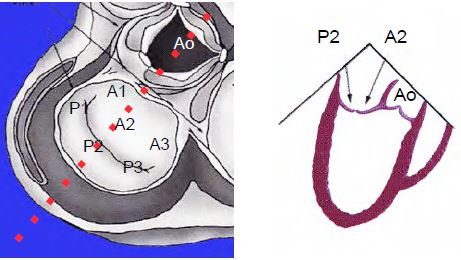
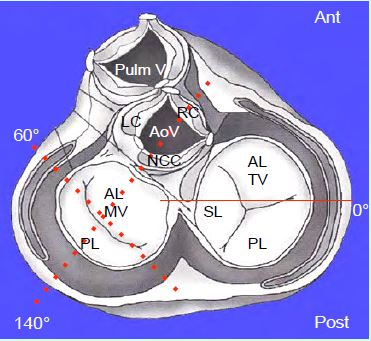
The TEE sensor is ideally placed to examine the mitral valve as it is only 4-5 cm from the oesophagus and separated from it only by the LA. The planes orthogonal to the body axis (0° and 90°) are not orthogonal to the mitral valve, whose orthogonal planes are 40-60° (bi-commissural view) and 120-150° (long-axis view of the LV) (Figure 11.21) [2]. Due to the D-shape of the mitral annulus, the valve has two different diameters: intercommissural (major) and anteroposterior (minor). In order to obtain a consistent assessment of the mitral valve, it is important to examine it in all available TEE planes.
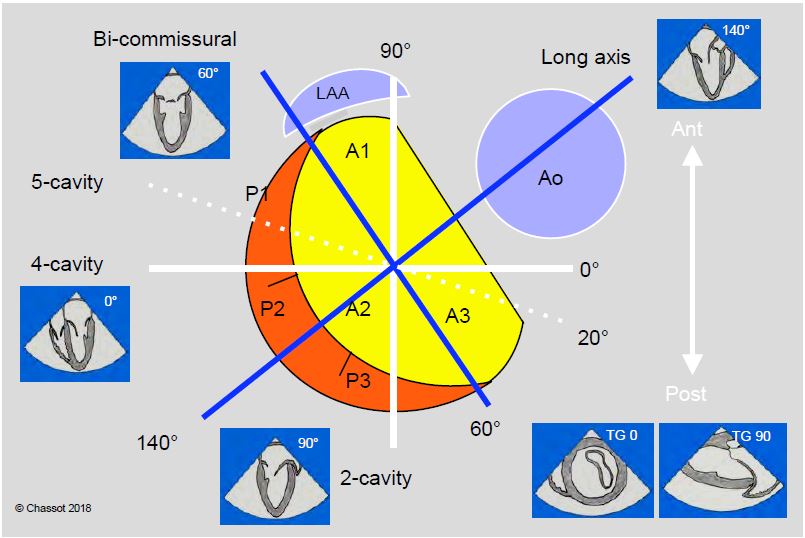
Figure 11.21: Schematic representation of the cross-sectional planes of the mitral valve seen from the LA. The mitral annulus has the approximate shape of an inverted letter 'D' with the base at an angle of approximately 60° to the horizontal. The orthogonal planes of the body (0° and 90°, white lines) are not orthogonal to the mitral annulus, whose orthogonal planes are 60° and 140° (blue lines). In addition to these 4 planes, the examination of the mitral valve includes transgastric views at 0° (basal short-axis) and 90° (LV long-axis).
- 4-cavity view (0-20°) (Figure 26.5). View of A2 and P1 or A3 and P2 depending on probe depth; view of anterior abutment. If the probe is withdrawn 0.5-1.0 cm in the 5-cavity view, the anterior commissure (boundary of A1 and P1) can be seen, which is perpendicular to the incisal plane. If we push the probe further (2-3 cm), we reach the posterior commissure (A3 - P3), but the section plane is parallel to it and does not allow us to identify it.
Video: Mid-oesophageal 4-5 cavity 0° view of the mitral valve; the anterior leaflet, the longest, is on the left of the screen, the posterior leaflet on the right; the aortic valve appears truncated on the left of the screen.
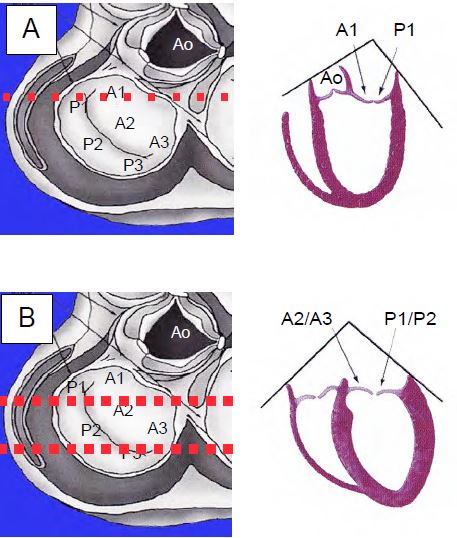
Figure 26.5: 4-cavity 0° views of the mitral valve. A: High in the oesophagus, the view cuts perpendicularly through the anterior commissure and A1 - P1; this view is suitable for diagnosing tilting of the anterior commissure. B: 4-cavity view of the middle and lower oesophagus; oblique section of the valve: P1-A2 and P2-A3; the section is parallel to the posterior commissure and does not allow correct visualisation.
- Bicommissural view (60°) (Figure 26.7). Orthogonal axis (vertical to "D") and large diameter D' (3.0-3.5 cm in protodiastole); view of P1, A2 and P3; anterior and posterior columns. Turning the probe slightly to the right (clockwise) visualises the base of the anterior leaflet; turning it slightly counterclockwise visualises the 3 posterior leaflets. The intertrigonal distance is approximately 0.8 times the width of the anterior leaflet at its base; it can be estimated from the distance between the two commissures (bicommissural distance) measured when the posterior leaflet festoons just disappear when the probe is rotated clockwise.
Video: Bicommissural view of the mitral valve (60°); the posterior part of the posterior leaflet appears on the left of the screen, and the anterior part on the right; in the middle is the central part of the anterior leaflet.
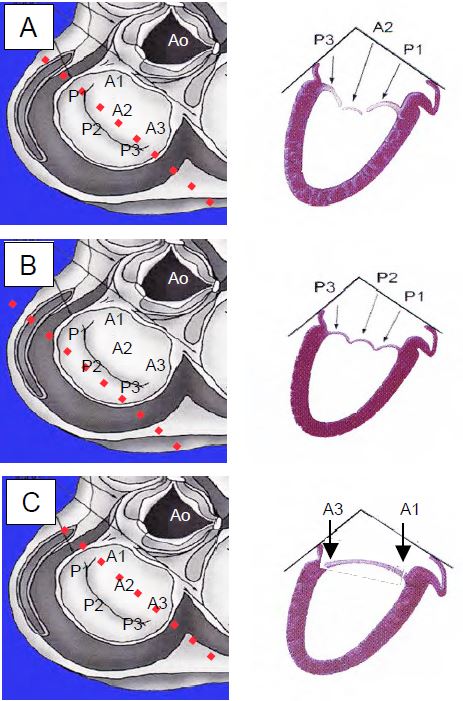
Figure 26.7: Bicommissural 60° views of the mitral valve. A: Views of P1, A2 in the middle and P3; large diameter of the annulus. B: By rotating the probe axis counterclockwise, the plane of section is rotated posteriorly, highlighting the 3 festoons of the posterior leaflet. C: Turning the axis of the probe clockwise rotates the plane forward; stopping the rotation when the commissures disappear gives the width of the anterior leaflet, corresponding to its base; multiplying this dimension by 0.8 gives a good approximation to the intertrigonal distance. This is used to determine the size of the mitral leaflet rings.
- 2-cavity (90°) mid-oesophageal view (Figure 26.6A). View of A1 and P3; posterior column. The posterior commissure is clearly visible as it is perpendicular to the plane of section.
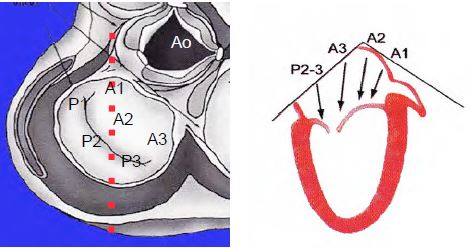
- Long axis view of the middle oesophagus (120-140°) (Figure 26.6B). Orthogonal axis (horizontal of "D") and diameter D'' (2.8-3.0 cm in protodiastole); view from A2 and P2; use this view to measure the length of the anterior leaflet in plasty (in diastole) and to define the retraction of the coaptation point in prolapse (in systole).
- Basal transgastric view (0°): short axis of the mitral valve (Figure 26.8A). Posterior leaflet (closest) and anterior leaflet (furthest), but inconsistent view; often only the distal part of the chords and the commissural zone of the leaflets are seen.
- Transgastric 2-cavity view (100°) (Figure 26.8B). View of A1 and P3, posterior (closest) and anterior (furthest) pillars, cords. Best view to assess the subvalvular apparatus.
Video: Transgastric 2-cavity view of the mitral valve (90°); the subvalvular apparatus is clearly visible.
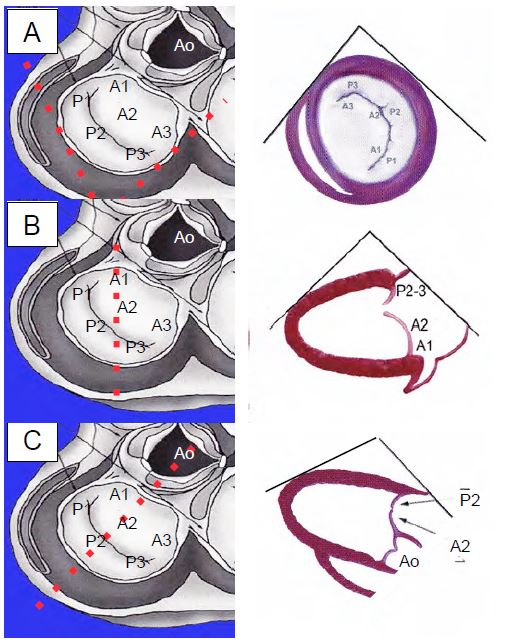
Figure 26.8: Transgastric views of the mitral valve. A: 0° short-axis view, not feasible in some patients. B: 90° 2-cavity view, with P3 and A1 (opposite the left atrial appendage). C: 120° long-axis view with A2 and P2. Transgastric views provide an optimal view of the subvalvular apparatus.
When visible in the cross-sectional plane, the RAA is opposite the anterior commissure (A1 and P1); when visible, the aortic valve is opposite the base of the anterior leaflet (A2). In systole, the two mitral leaflets are compressed over a certain height (6-10 mm at A2-P2); this coaptation height is calculated by subtracting the distance between the mitral annulus and the coaptation point in systole from the total length of the anterior leaflet measured in diastole (120° long axis view) (Figure 11.22). The examination is completed by colour and spectral Doppler imaging and haemodynamic calculations (see Doppler echocardiography and Haemodynamic measurements).
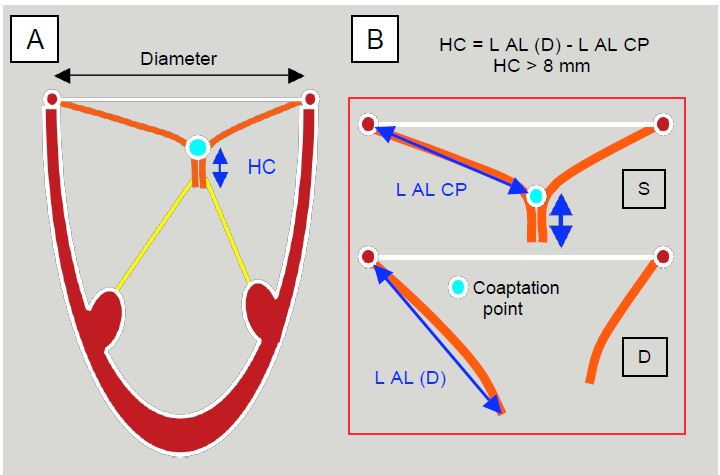
Figure 11.22: The height of the coaptation zone (HC) can be measured directly on the screen or calculated as the difference between the total length (L) of the anterior leaflet (AF) in diastole (D) and the length from the mitral annulus to the coaptation point (PC) in systole (S). This is usually 6-10 mm. The ratio of coaptation height to mitral annulus diameter is 0.2-0.25; the ratio of anterior leaflet length to mitral annulus diameter is 1.3 [7]. On TEE, these measurements are made in the 120-140° long-axis view, which shows the maximum length of the leaflets (A2-P2 section).
Aortic valve
The aortic valve is examined in four planes (Figure 11.23) [1].
- Short axis view of the basal mid-oesophagus (40°). View of the 3 cusps and their commissures; the NC cusp is opposite the interatrial septum. A small triangular area appears in the centre in diastole in moderate or severe insufficiency; the common trunk begins in the left coronary sinus of Valsalva (LC).
- Middle oesophageal long-axis view (120°). Depending on the depth of the probe, the LVOT (deep probe) or the ascending aorta (retracted probe) can be seen; view of the RC (anterior, next to the RVOT) and NC (posterior, next to the LA) cusps; sometimes the LC cusp instead of the NC (posterior, next to the LA, with origin of the common trunk); origin of the right coronary in the right sinus of Valsalva (see Figure 25.104). The aortic root diameter is measured in systole and only the largest value obtained is taken into account [5,6]:
- Diameter of the aortic annulus (18-25 mm);
- Diameter of the sinuses of Valsalva (21-35 mm);
- Diameter of the sinotubular junction (20-34 mm);
- Distance aortic ring - sinotubular junction (20-25 mm);
- Diameter of the ascending aorta at the level of the right pulmonary artery (22-35 mm); this measurement is made in diastole because the aorta distends in systole.
- Deep transgastric long axis view (0°). View of RC and LC cusps; alignment of LVOT - aortic valve - ascending aorta for Doppler flow measurements.
- Transgastric long axis view (120°). View of RC and LC cusps; LVOT - aortic valve - ascending aorta alignment for Doppler flow measurements. These two views, TG 0° and 120°, which are sometimes difficult to obtain, are generally mutually exclusive; one or the other is obtained depending on the position and remodelling of the LV.
Video: Transgastric long-axis view (120°) of the aortic valve; the ascending aorta is at the bottom of the screen and the LV at the top.
The 5-cavity view provides only a truncated view of the LC cusp, which protrudes over the LVOT.
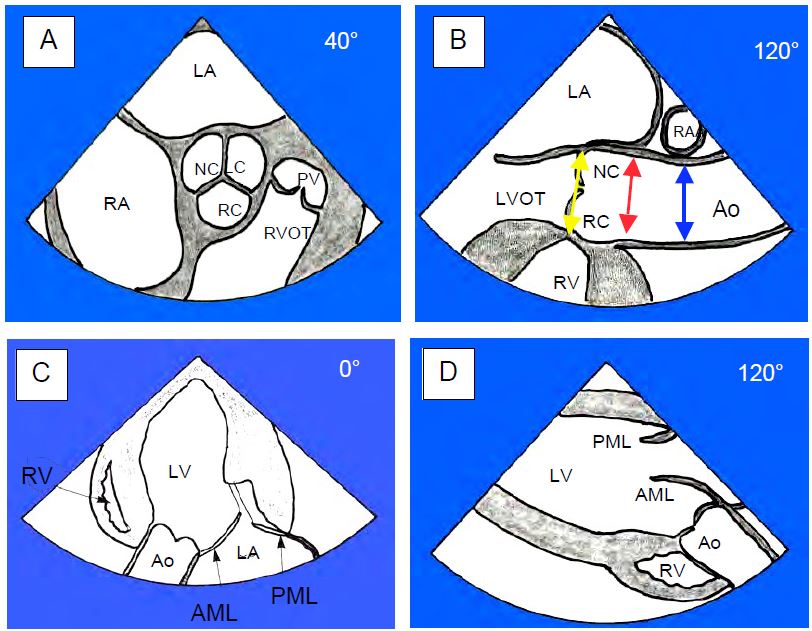
Figure 11.23: Cross-section of the aortic valve. A: Short axis view (40°); NC: non-coronary cusp; LC: left coronary cusp; RC: right coronary cusp; PV: pulmonary valve; RVOT: Right ventricle outflow tract. B: Long axis view (120°); points where the 3 diameters are measured: aortic annulus (yellow line), sinotubular junction (red line) and ascending aorta (blue line, at the level of the crossing of the right pulmonary artery RPA). C: Deep transgastric long-axis view (0°); view of the RC and LC cusps. D: 120° transgastric long axis view. These two TG 0° and 120° views (C & D) show good alignment for Doppler flow measurements [1].
Tricuspid valve
Planes of examination of the tricuspid valve (Figures 11.24A and 11.24B; see Figures 26.126 and 26.127):
- Mid-oesophageal 4-cavity view (0-20°). View of the septal leaflet and a second non-septal leaflet, which is the anterior leaflet when the probe is in the upper position (5-cavity) or the posterior leaflet when it is in the lower position (view of the coronary sinus). The septal leaflet is inserted approximately 1 cm below (apically) the anterior leaflet of the mitral valve. Usual measurement plane for annulus diameter (28-35 mm measured in telesystole). Good Doppler alignment with the tricuspid regurgitation flow, generally directed towards the interatrial septum.
- Inlet-outlet view of the RV (60°). View of posterior and anterior leaflets. Good alignment of the Doppler with the tricuspid regurgitation flow.
- Two-sided view (100-120°) modified by slight counterclockwise rotation of the probe; posterior and anterior leaflets.
- Transgastric inflow track view of the RV at 120° (Video). View of the posterior and anterior leaflets; view of the RVOT and pulmonary valve.
- Transgastric view of RV recording at 100°. View of posterior and anterior leaflets; posterior and anterior pillars; excellent view of the subvalvular apparatus.
- Transgastric view, RV view at 30-70° (short axis of the tricuspid valve. Posterior leaflet on the left, septal leaflet on the right, most distal anterior leaflet; this view is sometimes impossible to obtain; the angle at which it is obtained varies greatly.
- Apart from the transgastric short-axis view, which is difficult to obtain, the 4-cavity view is the only one in which the septal leaflet (the smallest of the three) is visible.
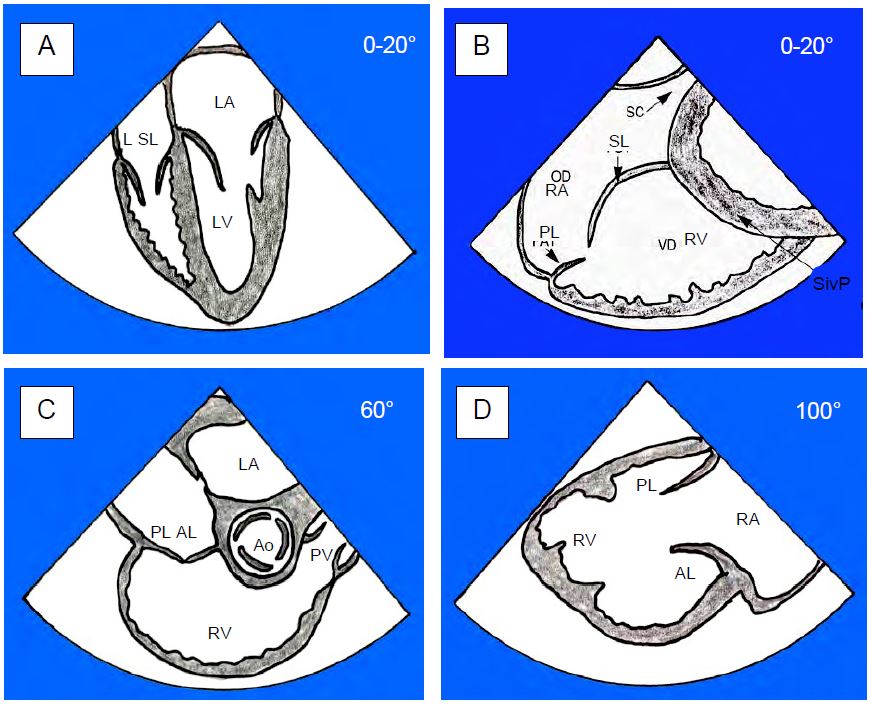
Figure 11.24 A: Cross-sections of the tricuspid valve. A: 4-cavity view. We see the septal leaflet (SL) and a second non-septal leaflet (L) which is the anterior leaflet (AL) when the probe is in the high position (5 cavities) or the posterior leaflet (PL) when it is in the low position (view of the coronary sinus). B: Deep 4-cavity view obtained by inserting the probe 2-3 cm deeper than in section A. The septal leaflet and the posterior leaflet (PL) are visible. CS: coronary sinus. PSiv: posterior interventricular septum. C: Admission tract view of the RV (60°). Presence of anterior and posterior leaflets. PV: pulmonary valve. D: Transgastric entry view of the RV with the AL and PL [1].
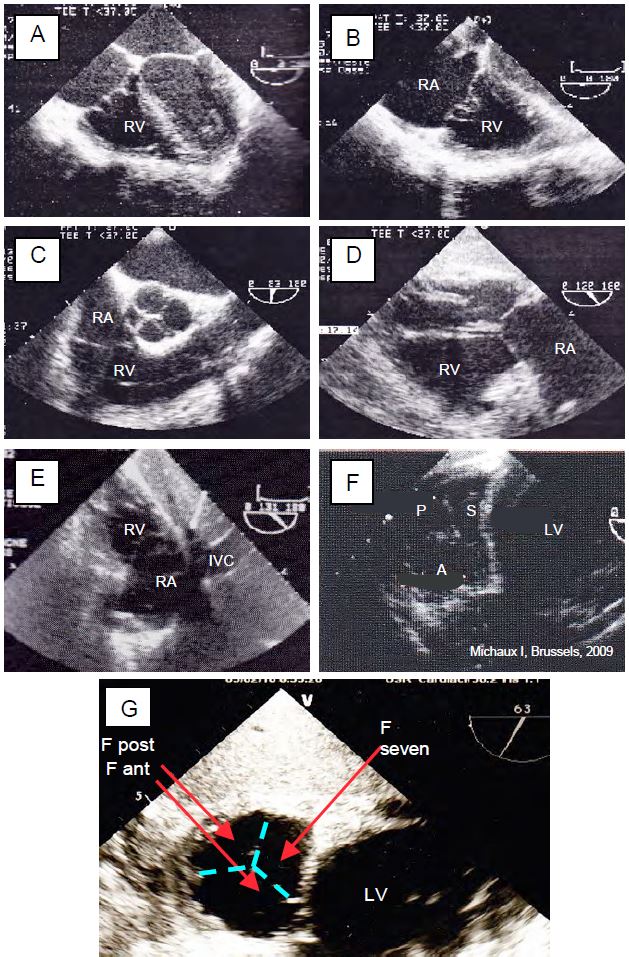
Figure 11.24 B: Normal TEE images of the tricuspid valve. A: 0° 4-cavity view (septal and non-septal leaflets). B: Deep 0° 4-cavity view (septal and posterior leaflets). C: 60° RV inlet/outlet view (posterior and anterior leaflets). D: 120° transgastric RV inlet/outlet view (posterior and anterior leaflets). E: 130° transgastric view of RV inlet with clockwise rotation of the probe (post and anterior leaflets). F: 30° transgastric short axis view with the 3 leaflets: anterior (A), posterior (P) and septal (S). G: Enlargement of the 60° transgastric short-axis view with the 3 leaflets positioned; this image is useful for localisation as the leaflets are thin and often poorly visible.
Pulmonary valve
The pulmonary valve is thin, not very echogenic and very anterior; it is difficult to visualise on TEE because it is in front of the aortic valve which acts as a screen. It is at the same level as the aortic valve but in a perpendicular plane: it appears in the short-axis plane of the aortic valve and vice versa.
Planes of examination of the pulmonary valve (Figure 11.24C; see Figures 26.128 and 26.129):
- Short axis view of the ascending aorta (0°). Focus on the pulmonary valve by adjusting the depth of the probe. Long-axis view of the pulmonary valve with the origin of the pulmonary artery (PA); good access to pulmonary flow measurement provided the Doppler axis is well placed in the centre of the PA.
- Inflow - outflow view of the RV (60°). Long axis view of RVOT (diameter 25-30 mm), pulmonary valve and root of PA; anterior leaflet (furthest away) and right or left depending on probe rotation.
- Basal long-axis view of the aortic valve (120-140°). Slight rotation of the probe to the right (clockwise); short-axis view of the pulmonary valve only; view of the 3 leaflets: left leaflet at 2 o'clock, anterior leaflet at 6 o'clock and right leaflet at 10 o'clock.
- Long axis TG view of the RV (30-60°). Modification of the TG view of the entrance to the RV (100°) by reducing the rotation of the transducer to 30-60° (highly variable angle); view of the RVOT, pulmonary valve and root of the PA; good Doppler axis for measuring flow in the RVOT (pulsed Doppler) and pulmonary valve (continuous Doppler).
- Short axis view of the aortic arch (90°); the valve appears at the bottom left of the screen.
Video: Short-axis view of the aortic arch 90° (top of screen); the pulmonary artery appears in the long-axis view, with the pulmonary valve at its base.
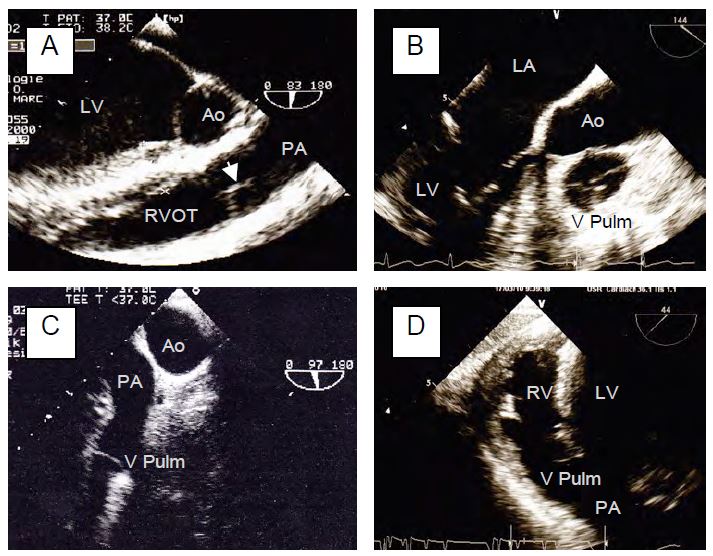
Figure 11.24 C: View of the pulmonary valve. It is not very echogenic because it is thin and very anterior, partially obscured by the aortic valve. A: 90° mid-esophageal view by clockwise rotation of the probe from a 2-cavity view of the LV; the arrow indicates the level of coaptation of the cusps. B: Short-axis view obtained from a long-axis view of the ascending aorta (120-160°); the 3 cusps are visible; the 3 commissural points are at 2 o'clock, 6 o'clock and 10 o'clock. C: Short axis view of the aortic arch at 90° providing a long axis view of the PA. D: Transgastric view of the RV at 40°; the pulmonary valve is an extension of the RV outflow tract.
4-cavity view
The 4-cavity view (0-20°) is essential to assess the remodelling of the ventricles caused by the valvular disease(s). The way in which the heart has remodeled in response to the new haemodynamic conditions imposed by the pathology allows the predominant lesion to be identified. This information is essential for the anaesthetist to anticipate the haemodynamic behaviour of the patient. It is a good idea to start the examination with this view, as it provides the general framework for the details observed later on the valves.
TM mode
The time-motion mode (TM or M-mode) plays back the movements of the structures traversed by the analysis axis in time. It allows precise measurement of anatomical dimensions and the kinetics or synchronisation of different events. The analysis axis generally follows the scan radius of the transducer, but can be independent of it in newer ultrasound scanners (anatomical TM). To detect structures in TM mode, it is important to first identify them on the moving two-dimensional slice. The vertical axis of the TM is graded in cm. In the valvular field, for example, it is used to analyse the opening of the aortic valve (ejection time) in short-axis TM (40°) or to measure the duration and timing of mitral regurgitation (colour TM mode) (Figure 25.129 B and Figure 26.31).
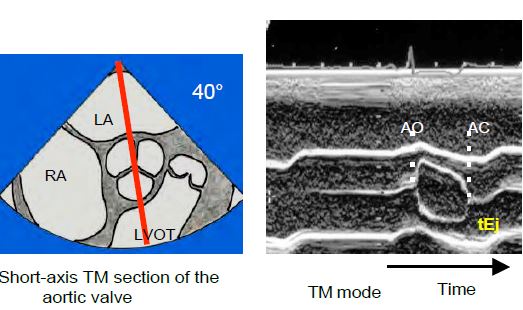
Figure 25.129 B: Short-axis view of the aortic valve; the TM mode sequence shows the opening of the aortic valve and allows the ejection time (tEj) to be calculated. AO: Aortic valve opening. AC: Aortic valve closure.
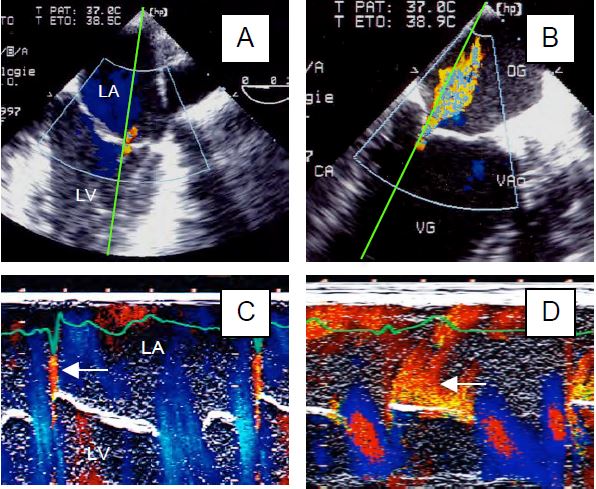
Figure 26.31: Assessment of MI by jet duration using colour Doppler in time-motion (TM) mode. A: Minimal protosystolic MI. B: Moderate pansystolic MI. C and D: Duration of MI as seen in TM mode, i.e. the time course of the image recorded along the green axis. A short protosystolic MI appears as a simple flare (arrow in C) and a pansystolic MI appears as a curtain (arrow in D).
Three-dimensional (3D) imaging
Even with multiple slice planes, conventional two-dimensional (2D) echocardiography does not allow perfect reconstruction of cardiac structures in space. In addition, haemodynamic calculations are all based on the same approximation: the cross section of the channels and orifices through which the blood passes is assumed to be circular. A 3D examination, on the other hand, allows the image to be viewed directly in three dimensions and the planimetry of the ducts or orifices to be determined, whatever their shape. 3D improves the visualisation of structures, avoids the laborious mental reconstruction imposed by several two-dimensional planes, and greatly facilitates communication with the operator. Echo machines generally have four different 3D analysis modes [3].
- Simultaneous examination in 2 different planes (X-plane); whatever the first image, the second is a plane of 30° to 150° in relation to the first and is displayed in parallel. Colour Doppler can be superimposed.
- 3D in real time (live 3D); the analysis covers a volume limited to a 30° x 60° pyramid, but with excellent spatial and temporal resolution.
- 3D zoom; in this variant of the previous mode, the sector is enlarged at the expense of spatio-temporal resolution.
- Full Volume mode; the region of interest defined on the usual 2D image is acquired as a wide-angle pyramidal volume (from 65°x56° to 102°x105°) with high spatial and temporal resolution, but over 1 to 16 cardiac cycles and reconstructed by synchronisation with the ECG, which requires a certain amount of time, the absence of arrhythmias, the absence of coagulation forceps use and the interruption of ventilation. This mode provides loop reconstruction with a fast frame rate (> 30 Hz), but is not real time. Colour Doppler can be added to measure the cross-sectional area of the jet of insufficiency or stenosis. This mode can then be used for cropping and viewing in any plane (Figure 25.140).
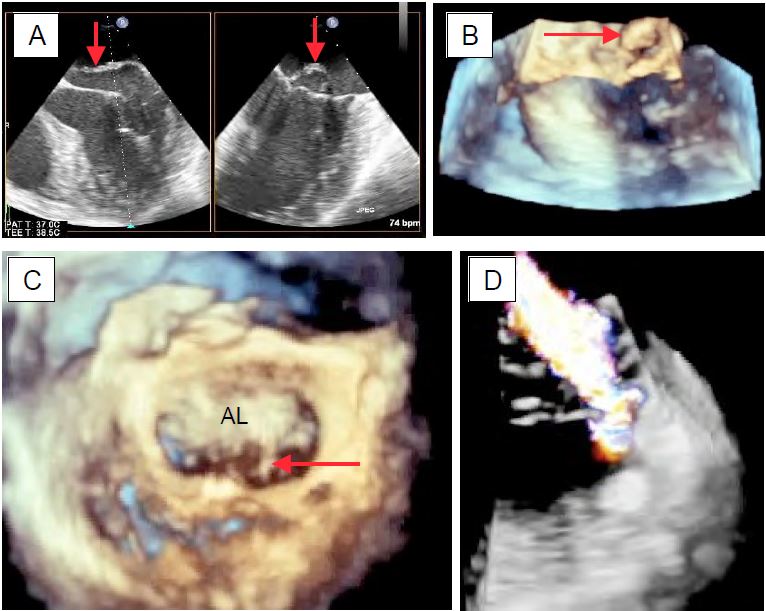
Figure 25.140: Three-dimensional view of the mitral valve. A: Prolapse with flail of P2 in X-plane view (2 simultaneous orthogonal planes). B: Tilt of the posterior leaflet in live 3D view. C: Chordal rupture (arrow) and A3 prolapse in full volume 3D reconstruction. D: MI jet superimposed on colour flow in 3D imaging.
- Its mathematical formulation means that EF tends to 1 (or 100%) when telesystolic volume (Vts) tends to zero; this occurs when the LV cavity is very small in telesystole, as in concentric hypertrophy (aortic stenosis), hypovolemia or vasoplegia. When the LV is dilated, the EF tends to fall because the high Vtd is in the denominator. These changes occur without compromising myocardial contractility.
- Like all ejection indices, EF is sensitive to loading conditions; it depends on preload (Starling's law) and afterload (wall stress). However, the loading conditions are significantly altered in valve disease: increased afterload in aortic stenosis, increased preload and reduced afterload in mitral regurgitation, for example.
- EF is a volume metric, but conventional two-dimensional echo only measures diameters and surfaces. To go from 2D to 3D, we use geometric approximations that assume the LV has a simple shape in which the measurement of the short axis diameter alone can be used to calculate volume (Teichholz formula, where the short axis is half the long axis). However, this only applies to a ventricle with a normal configuration and does not work correctly when the LV becomes spherical due to dilation (volume overload, decompensation).
- Telesystolic diameter in heart failure:
- Normal maximum LV diameter (Dts): 4 cm or 2.5 cm/m2;
- Maximum surface area (Sts) short axis (ETO): 6.5 cm2/m2 .
- Telesystolic dimension (td) in stenoses:
- Normal maximum LV ttd: 7 cm or 4 cm/m2 ;
- Maximum short axis ttd (ETO): 12 cm2/m2 .
- Degree of myocardial hypertrophy;
- Normal thickness of LV (posterior wall): 0.8 - 1.2 cm.
| Valve examination |
|
Mitral valve
-Rotated 60° to the body axis
-Orthogonal axes: 60° and 120-140°.
-Diameter measured at 60° and 120-140°.
-Length of leaflets measured at 120-140°.
Aortic valve
-Non-coronal cusp opposite the septum
-40° short axis and 120° long axis
-Diameter measured at 120°.
Tricuspid valve
-4-cavity 0°: septal F + anterior F or posterior depending on depth of section
-60° and TG: F anterior and F posterior
Pulmonary valve
-Anterior, long axis 60°, short axis 140°, anterior, long axis 60°, short axis 140°.
The 4-cavity view (0-20°) is essential to assess the remodelling caused by valvular disease and to determine the dominant haemodynamic stresses.
 |
© CHASSOT PG, BETTEX D, August 2011, last update November 2019
References
- BETTEX D, CHASSOT PG. Transoesophageal echocardiography in anaesthesia and intensive care. Paris: Masson, Williams & Wilkins, 1997, 454 pp.
- LAMBERT AS, MILLER JP, MERRICK SH, et al. Improved evaluation of the location and mechanism of mitral valve regurgutation with a systematic transesophageal echocardiography examination. Anesth Analg 1999; 88:1205-12
- LANG RM, BADANO LP, TSANG W, et al. EAE/ASE recommendations for image acquisition and display using three-dimensional echocardiography. Eur Heart J Cardiovasc Imaging 2012; 13:1-46
- NISHIMURA RA, OTTO CM, BONOW RO, et al. 2014 AHA/ACC Guideline for the management of patients with valvular heart disease. Circulation 2014; 129:e521-e643
- OH JK, SEWARD JB, TAJIK AJ. The echo manual. 3rd edition. Philadelphia, Lippincott Williams & Wilkins, 2006, 189-242of patients undergoing aortic valve bypass (api-aortic conduit) surgery. J Cardiothorac Vasc Anesth 2012; 26:148-60
- SAVAGE RM, ARONSON S, SHERNAN SK. Comprehensive textbook of perioperative transesophageal echocardiography, 2nd edition. Philadelphia: Wolters/Kluwer - Lippincott, Williams & Wilkins, 2011,
- YAMAUCHI T, TANIGUCHI K, KUKI S, et al. Evaluation of the mitral valve leaflet morphology after mitral valve reconstruction with a concept of "coaptation length index". J Card Surg 2005; 20:432-5
- ZOGHBI WA, ADAMS D, BONOW RO, et al. Recommendations for noninvasive evaluation of native valvular regurgitation: a report from the ASE developed in collaboration with the SCMR. J Am Soc Echocardiogr 2017; 30:303-71