Continuity equation
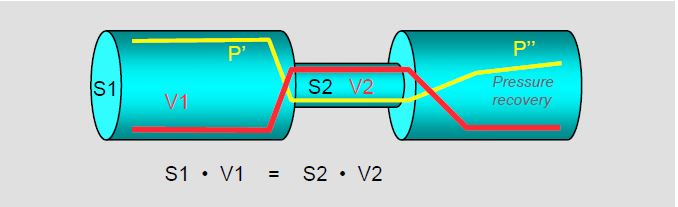
The continuity equation expresses the law of conservation of energy. It states that the flow, the product of surface area and velocity (S · V, in cm3 /s), is the same along the entire length of a path:
S1 · V1 = S2 · V2
where S and V are the areas and velocities at two different points (Figure 11.28A). If S1, V1 and V2 are known, then S2 can be calculated:
S2 = ( S1 · V1 ) / V2
Figure 11.28 A: The continuity equation expresses the law of conservation of mass: the product of the velocity of the flow (red line) and the area of the pipe is constant. In the constricted area, the velocity increases but the pressure (yellow line) decreases; this is the principle of conservation of kinetic energy. In the area distal to the constriction, the pressure increases again (pressure recovery), with a loss of pressure due to friction and turbulence (P'' < P'). Echocardiography measures the pressure gradient from maximum velocity: Δ P = 4 (V22 - V12 ), i.e. before pressure recovery [4].
Apart from losses due to friction, the product of kinetic energy (KE) and pressure energy (E) remains constant. When passing through a stenosis, the velocity increases (increase in KE) and the pressure decreases (decrease in E); this is the situation at the level of the vena contacta. After the stenosis, the receiving chamber is wide, the velocity decreases and the pressure increases again: this is the phenomenon of pressure recovery or reconversion of KE into E distal to the vena contracta. This conversion can represent a 20% reduction in the true pressure gradient across an aortic stenosis [1].
Vmax represents the flow velocity at a given moment in systole or diastole, but this flow can change over the course of the cardiac cycle. For this reason, it is preferable to use the integral of velocities (VTI, in cm), as it represents all velocities in relation to time (flow duration). The product of the surface area S (in cm2 ) and the VTI (in cm) gives the systolic or diastolic volume (cm3 ). The VTI is obtained by drawing the flow envelope on the screen.
For example, if we are looking for the area of aortic stenosis, we can calculate it from the stroke volume in the LV outflow tract (LVOT) and the VTI flow through the aortic valve:
SAo = ( SLVOT - VTILVOT ) / VTIAo
- SLVOT : surface area of the LVOT calculated from its diameter measured in the long-axis retrocardiac view at 120° (average 2.0-2.2 cm). However, the cross section of the LVOT is not circular but oval and the echocardiographic view measures the small diameter of this oval, resulting in a 17% underestimation of the true diameter; this error is then squared to calculate the surface area (24% difference) [3].
- VLVOT : maximum velocity or ITV of the LVCC measured by pulsed Doppler in the 0° or 120° transgastric long-axis view; the window is positioned 2-3 mm anterior to the aortic valve, in the middle of the flow.
- VAo : maximum velocity or IV across the aortic valve measured with continuous Doppler in the transgastric long-axis view at 0° or 120°. Whereas transthoracic echo (TTE) can record Vmax of the vena contracta downstream of the valve from the suprasternal recess, TEE can only be positioned in the axis of aortic flow in the transgastric position, i.e. upstream of the valve. The Doppler axis must therefore cross the stenosis in order to image the vena contracta, which can be very difficult in a stenotic, calcified and highly modified valve. Vmax is generally underestimated by TEE.
- As the Doppler axis defects are approximately the same in LVOT and aortic stenosis, the VLVOT /VAo ratio has the advantage of eliminating this source of error. Normally this ratio is ≥ 0.8; in aortic stenosis it is ≤ 0.25, which means that Vmax across the valve is at least 4 times greater than in the LVOT.
This calculation can be done in the same way at different points in the flow, but always with the Doppler axis in the centre of the flow to avoid velocity variations associated with walls and curvatures. In general, it is more appropriate to replace Vmax with the integral of velocities (VTI) in the calculation.
Bernoulli equation
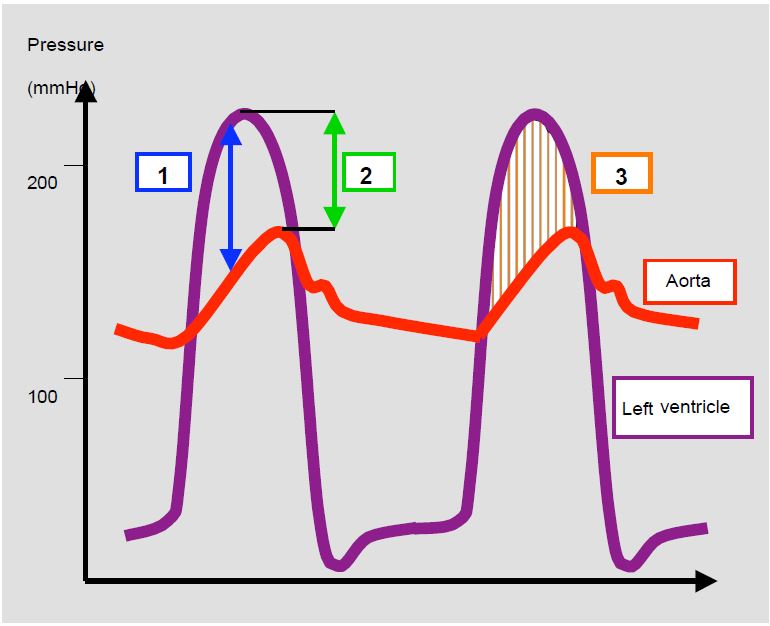
Bernoulli's equation can be used to measure the instantaneous pressure gradient (Δ P) across an orifice or between two cavities. As Vmax is used for this calculation, we are actually measuring the maximum gradient that occurs during the peak velocity. This Δ Pmax is always higher than the peak-to-peak gradient measured by catheterisation, as the latter does not correspond to simultaneous pressures (Figure 11.28B). The mean gradient, which is the average of all instantaneous gradients, is identical when measured by echocardiography or catheterisation.
In Bernoulli's equation we neglect the factors associated with local acceleration, which is only significant for long stenoses, and friction, which is only significant for haematocrits > 60%. We obtain a modified equation:
ΔP = 4 · (V22 -V12 )
where V1 is the velocity upstream of the orifice and V2 is the velocity downstream. If V1 is < 1.5 m/s, this factor can be neglected and the simplified equation becomes
ΔP = 4 · (Vmax)2
Omitting V1 is very convenient for calculation but can seriously overestimate the gradient if the upstream velocity is high. This is particularly important in the aortic position; ignoring the velocity in the outflow tract leads to an overestimation of the gradient across the aortic valve of 9 to 30 mmHg. The simplified Bernoulli equation is very accurate except in three cases:
- Vmax upstream (V1) > 1.5 m/s; use the full equation: ΔP = 4 ·(V22 - V12);
- Presence of two consecutive stenoses;
- Long stenosis (tunnel effect) or high haematocrit (Ht > 60%).
The axis of the Doppler measurement should always be as close as possible to the axis of the flow being measured. Calculating the gradient between two cavities allows the pressure in one to be measured if the pressure in the other is known. For example, Vmax in tricuspid regurgitation gives the pressure gradient between RV and RA in systole; adding PRA to this gradient gives the systolic pressure of RV, which is in principle equal to the systolic PAP: PAPs = 4 - (Vmax TI) 2 + PRA (see Tricuspid insufficiency, Calculation of PAP).
Figure 11.28 B: Pressure gradients. Illustration of the different pressure gradients in aortic stenosis. 1: Maximum instantaneous gradient (Doppler echocardiography); this occurs during the protosystolic acceleration phase of the flow. 2: Peak-to-peak gradient (catheterisation withdrawal curve, needle puncture upstream and downstream of the valve); this gradient does not really exist because it is measured between points that are not simultaneous 3: Mean gradient (average of all instantaneous maximum gradients). The instantaneous maximum gradient is higher than the peak-to-peak gradient, but the mean gradient is more or less identical, whatever the measurement technique.
Doppler flow measurements are obviously influenced by the haemodynamic state of the patient. For the same orifice area, the gradient across a valve increases when :
- Systolic/diastolic volume increases;
- Upstream pressure increases;
- Downstream pressure decreases.
Under the opposite conditions, the gradient decreases. When taking quantitative measurements (for example, the area of a stenosis or the regurgitant orifice of an insufficiency), it is essential to restore haemodynamic conditions as close as possible to the norm (normovolaemia, normotension, satisfactory contractility), even if this means temporarily subjecting the patient to an exercise test with a vasoconstrictor and/or an inotropic agent. On the other hand, it is always preferable to use measurements that are less dependent on haemodynamics, such as two-dimensional planimetry (when feasible) or the diameter of the vena contracta.
In general, valve disease caused by organic lesions is less dependent on haemodynamics than functional insufficiency. However, the patient in the operating theatre is in a very different situation to that in the cardiology department. He is asleep and ventilated under positive pressure, his sympathetic tone is reduced (lower SAR and cardiac output) and the pressure regime in his chest cavity is abnormal. Under these conditions, mitral regurgitation can be halved [2].
| Haemodynamic conditions |
| Pressure gradient between 2 cavities (Bernoulli's equation)
ΔP = 4 · (V22 - V12 )
When V1 < 1.5 m/s : ΔP = 4 · (Vmax)2
Continuity equation
S1 · V1 = S2 ·V2 Therefore : S2 = (S1 · V1) / V2
Flow (in a tank or through an orifice)
F = S (cm2) · Vmax (cm/s)
Stroke volume
VS = S (cm2 ) · VTI (cm)
(VTI: integral of the velocities measured by the envelope of the pulsed or continuous Doppler spectral flow)
|
© CHASSOT PG, BETTEX D, August 2011, last update November 2019
References
- BAX JJ, DELGADO V. Advanced imaging in valvular heart disease. Nat Rev Cardiol 2017; 14:209-23
- GREWAL KS, MALKOWSKI MJ, PIRACHA AR, et al. Effect of general anesthesia on the severity of mitral regurgitation by transesoophageal echocardiography. Am J Cardiol 2000; 85:199-203.
- O'BRIAN B, et al. Integration of 3D imaging data in the assessment of aortic stenosis: impact on classification of disease severity. Circ Cradiovasc Imaging 2011; 4:566-73
- ZOGHBI WA, ADAMS D, BONOW RO, et al. Recommendations for noninvasive evaluation of native valvular regurgitation: a report from the ASE developed in collaboration with the SCMR. J Am Soc Echocardiogr 2017; 30:303-71