Spectral display
When the structure being scanned by the ultrasound beam is moving, it sends back an echo with a positive frequency shift if it is moving towards it or a negative one if it is moving away; this is the Doppler effect. The difference between the transmitted frequency and the received frequency is used to calculate the speed at which the target is moving. By measuring the velocity of the blood cells, we can measure the speed of the blood flow. This is displayed on the screen in the form of a spectrum of velocities over the observation time (spectral Doppler) and gives a representation of the blood flow through the observed structure. Two technical modalities are available (see Figure 25.17).
- Pulsed Doppler: The Doppler analysis takes place at a precise point along the interrogation axis; the position of the sampling window (sampling volume) is set by the observer. This advantage is offset by a disadvantage: the maximum speed that can be recorded is limited (0.6-1.2 m/s depending on depth).
- Continuous Doppler: The Doppler analysis takes place along the entire interrogation axis and records all velocities encountered along this axis; only the observer knows where the maximum displayed velocity occurs. This disadvantage is offset by the fact that there is no limit to the maximum speed that can be recorded.
Colour Doppler
Colour Doppler is a variant of pulsed Doppler in which the direction of flow is translated by a colour code and the velocity by the intensity of that colour. Accelerated or vortex flow takes on a multi-coloured mosaic appearance. Colour flow is the simplest way to visualise valvular insufficiency and to demonstrate acceleration through a stenosis. At rest, blood flow in the ventricles is physiologically laminar and therefore quiet. Any vortex indicates pathological acceleration: valvular stenosis, regurgitation from a high-pressure cavity to a low-pressure cavity, simple cardiac etherism or localised turbulence in the vicinity of a sclerosis. The vortices of these eddies cause disturbances that are visible on Doppler echocardiography. The colour flow gives rise to a phenomenon known as spectral overlap or aliasing, which consists of an inversion of the colour code when the speed of the flow exceeds the recording rate of the device. This phenomenon is analogous to the slow reversal that occurs in cinema when the speed of a wheel (number of revolutions per second) exceeds the recording rate of the camera (number of frames per second).
Colour flow imaging allows quick and easy assessment of flow in valvular disease, but has limitations that must be understood to avoid dangerous misinterpretation (Figure 11.25 and Figure 11.26).
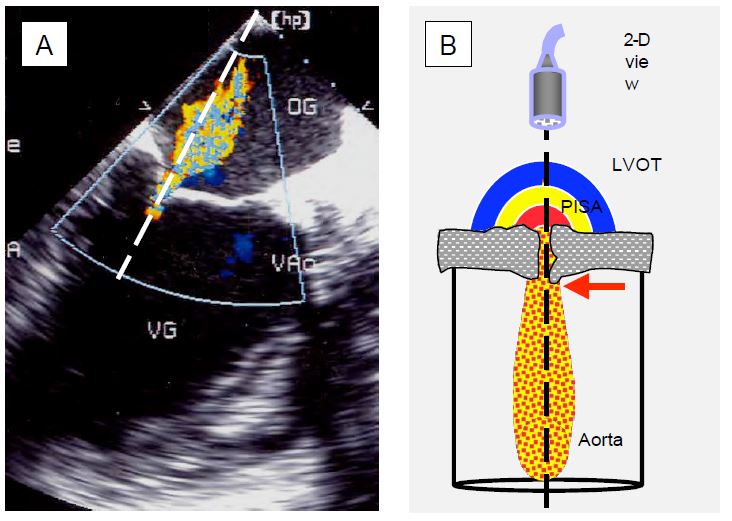
Figure 11.25: Echocardiography in Doppler mode. A: Mitral regurgitation in the long-axis view of the LV; the Doppler beam (dotted) is well aligned with the flow of the MI, represented by the coloured Doppler flow. B: Schematic representation of the Doppler beam through the aortic stenosis in transgastric view; in order to analyse the flow through the stenosis consistently, the Doppler axis must pass through the prestenotic acceleration zone (PISA), the narrowed orifice with the vena contracta (laminar flow, red arrow) at its exit, and the turbulent zone in the aortic root; the maximum velocity flow is recorded at the level of the vena contracta.
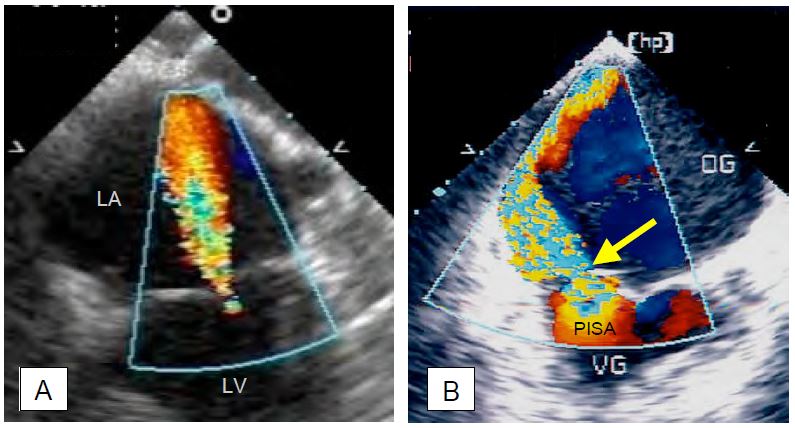
Figure 11.26: Mitral regurgitation (MI) in a 4-chambers TEE view (0°). A: Concentric, circularly symmetric MI; this type of regurgitation has the same appearance in all planes. As the MI (Vmax 5-6 m/s) recruits blood already in the LA by the Venturi effect and is directed towards the sensor, the extent of the colour jet tends to overestimate the size of the regurgitant volume. In this case, the MI is mild to moderate because it is thin at its origin and does not have a zone of concentric acceleration (PISA) on the venous side. B: Eccentric MI in posterior leaflet prolapse. This MI slows down when it hits the atrial wall, has little Venturi effect and presents a very different image depending on the plane of analysis; in fact, it spreads over a large part of the LA wall, but the image is always a tomography and shows only a section of this wide jet. As a result, the colour image underestimates the extent of the regurgitation. In this case, the MI is severe, as shown by the width of the vena contracta (yellow arrow) and the presence of a large PISA on the ventricular side.
- The colour flow image is a map of velocities, not of actual blood volume. The velocity of a flow is an expression of the instantaneous pressure gradient between the upstream and downstream cavities; for example, Vmax in mitral regurgitation (MI) decreases when left ventricular function is reduced, and Vmax in aortic regurgitation (AR) increases when SAR is high.
-
For the same upstream pressure, flow velocity is inversely proportional to the size of the orifice: it decreases when the orifice is very wide.
-
Two-dimensional imaging produces a tomography and only shows the size of the jet in one plane; whereas central jets tend to be circularly symmetric, eccentric jets hitting a wall have a highly variable geometry that is not visible in the cross-sectional plane. The two-dimensional colour jet gives a reliable representation of the former, but tends to underestimate the importance of the latter because it does not visualise their extent in space.
Vidéo: Mitral insufficiency type 1
Video: Type II eccentric mitral insufficiency due to prolapse of the posterior leaflet; the jet is directed towards the interatrial septum.
-
A high velocity central MI jet (Vmax 5-6 m/s) recruits blood volume already in the LA by the Venturi effect, whereas an eccentric MI jet slows down as it hits the wall of the LA and is not amplified by the Venturi effect. Again, the colour jet tends to overestimate the importance of the former and underestimate that of the latter [4].
-
The Doppler effect is maximal when the flow and the interrogation axis are in the same direction. The jet of an MI shows maximum development in mid-oesophageal retrocardiac views because its flow is well aligned with the Doppler axis, whereas the jet of an AI is greatest in transgastric views where it is oriented towards the sensor.
-
Maximum velocity should be measured at the point of greatest stenosis, i.e. between the leaflets of the valve or immediately downstream (vena contracta), not at a distance; this applies to both stenosis and regurgitation.
-
Imaging intuitively assumes that orifices are circular, but they are often oval, slit-shaped or of complex geometry, so it is important to always assess in at least two orthogonal planes.
-
In a murmur, the volume regurgitated depends on the duration of the flow; if the flow is short, the murmur is much smaller than in a pansystolic (MI) or pandiastolic (AI) murmur.
-
The measurement scale (Nyquist limit) must be adapted to flow velocity being measured; if it is too low, vortices will appear throughout the sector, but if it is too high, slow flows will no longer be represented.
- The gain must be adjusted so that it just eliminates the small coloured spots that appear outside the ventricles and vessels if it is too high (this adjustment is automatic in most machines).
Vena contracta
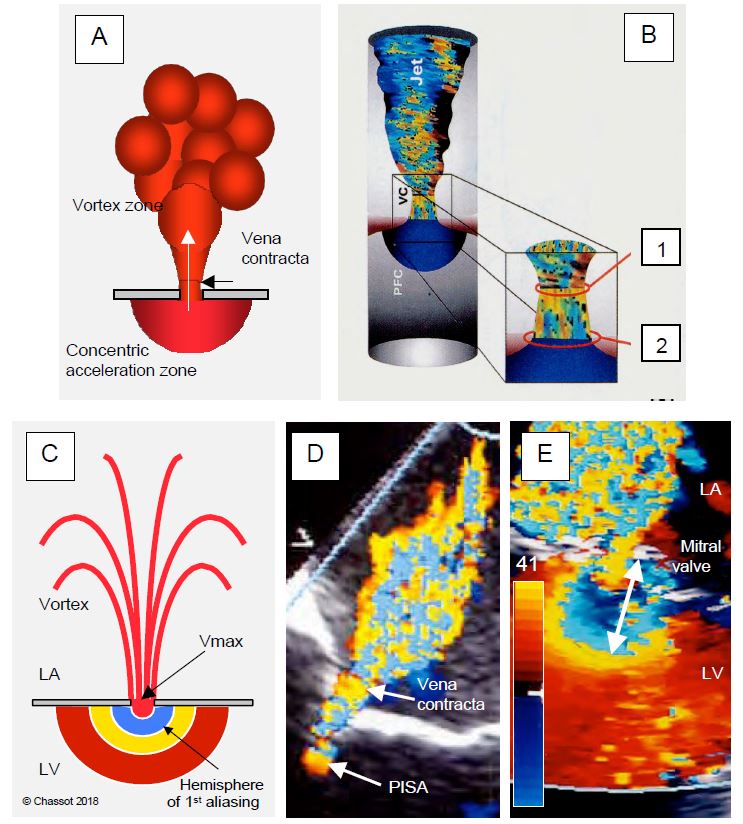
In a constriction, the flow tends to flow in the central part because the outer zones are slowed down by friction against the walls. The flow is laminar and remains so at the outlet, only becoming turbulent at some distance. Its smallest diameter is not at the orifice itself, but immediately after, at a point known in hydrodynamics as the vena contracta (Figure 11.27) [14,15]. As the blood flow there is still laminar, the size of this zone faithfully reproduces the shape of the flow in the stenosis, but its cross-sectional area is slightly smaller than that of the anatomical orifice (GOA geometrical orifice area). Measurement of the diameter of the vena contracta is an excellent technique for assessing the effective orifice area (EOA effective orifice area) of a stenosis or regurgitation because it is independent of flow velocity and pressure force. As a result, it remains valuable in acute failure where the lack of downstream cavity dilatation leads to rapid pressure equalisation and ventricular dysfunction reduces jet velocity and hence its apparent area. The size of the vena contracta correlates better with haemodynamic effects and prognosis than the anatomical area of the orifice. Failure is severe when the diameter of the vena contracta is > 0.7 cm in MI or IT and > 0.6 cm in IA.
Figure 11.27: Proximal isovelocity surface area (PISA) and vena contracta in mitral regurgitation in a mid-esophageal retrocardiac view. A: Schematic representation; the PISA is a concentric hemisphere centred on the orifice and located in the chamber upstream of the flow; the vena contracta is the narrowest zone of laminar flow exiting the orifice. B: The cross-sectional area of the vena contracta (1) is slightly smaller than that of the anatomical orifice (2). C: As it gradually accelerates towards the orifice, the Doppler flow crosses the Nyquist limit (aliasing) and changes colour, moving from the yellow end of the colour scale to the blue end (E). The greater the volume of blood passing through the orifice, the greater the PISA. D: Mild to moderate mitral regurgitation: The PISA is tiny and the vena contracta is narrow. E: Image of severe mitral regurgitation; when the colour scale is set to 35-50 cm/s (here 41 cm/s), an aliasing radius of 1 cm (white arrow) corresponds to a regurgitant orifice area of 0.5 cm2 (severe MI). The main difficulty with this measurement is to accurately define the plane of the regurgitant orifice at leaflets level .
Video: zone of concentric acceleration (PISA) on the ventricular side of a central mitral insufficiency; as it accelerates, the flow changes from red to yellow to blue.
- LVOT: Measurement of diameter (mean: 2.0-2.2 cm) in 4-chamber or long-axis retrocardiac mid-oesophagus; measurement of flow by deep transgastric approach (long-axis 0° or 120°) with pulsed Doppler. 3D echo shows that two-dimensional measurements of the LVOT underestimate its surface, which is elliptical rather than circular [10].
- Aortic valve: measurement of surface area in its triangular mesosystolic orifice (basal retrocardiac view, short axis 40°); measurement of flow by transgastric route (long axis 0° or 120°) with continuous Doppler. The aortic valve has a circular orifice only in the protocole; for more than 2/3 of systole it is triangular (S = 0.433 · L 2).
- Mitral valve: measure the area of the orifice (S = 0.785 · D2 ) by averaging the diameter of the annulus at 60° and 120° retrocardiac in protodiastole; measure the flow using pulsed Doppler by positioning the window at the mitral annulus (and not at the tips of the leaflets). This is the least reliable method.
- Right cardiac output is measured via the RVOT (transgastric view 40° or 100°) or via the pulmonary artery (short axis view ascending aorta 0-20°); measure PA diameter in systole and pulsed Doppler flow strictly at the same level.
- 3D echocardiography measures the volume of the LV in systole and diastole fairly reliably; by subtracting Vtd - Vts we obtain the systolic volume.
| Colour Doppler |
|
The extension of the colour jet in valvular regurgitation does not represent the volume regurgitated; it is a mapping of velocities, which is itself a function of the colour scale:
- Colour scale (Nyquist limit) and amplification
- Pressure gradient across the valve
- Orifice size
Colour jet overestimates insufficiency in the case of: central jet, high upstream pressure, small orifice.
Colour jet underestimates insufficiency in: eccentric jet, low engine pressure, very large orifice.
Valvulopathy: Doppler analysis recommendations
Doppler axis well aligned with the axis of insufficiency or stenosis through the valve orifice.
Good anatomical course of the downstream cavity in the Doppler axis.
Analysis of Vmax at the level of the vena contracta.
Measurement in 2 orthogonal planes.
Consistency of results with 2D measurements (regurgitation orifice) and cavity remodelling.
|
© CHASSOT PG, BETTEX D, August 2011, last update November 2019
References
- ADDA J, MIELOT C, GIORGI R, et al. Low flow/low gradient severe aortic stenosis despite normal ejection fraction is associated with severe left ventricular dysfunction as assessed by speckle-tracking echocardiography: a multicenter study. Circ Cardiovasc Imaging 2012; 5:27-35
- BAX JJ, DELGADO V. Advanced imaging in valvular heart disease. Nat Rev Cardiol 2017; 14:209-23
- BETTEX DA, HINSELMANN V, HELLERMANN JP, JENNI R, SCHMID ER. Inaccuracy of cardiac output determination by transoesophageal echocardiography. Anaesthesia 2004; 59:1184-92
- CAPE EG, Yoganathan AP, Weyman AE, LEVINE RA. Adjacent solid boundaries alter the size of regurgitant jets on Doppler color flow maps. J Am Coll Cardiol 1991; 17:1094-102
- DARMON PL, HILLEL Z, MOGTADER A, et al. Cardiac output by transesophageal echocardiography using continuous-wave Doppler across the aortic valve. Anesthesiology 1994; 80:796-805
- LANCELLOTTI P, TRIBOUILLOY C, HAGENDORFF A, et al. Recommendations for the echocardiographic assessment of native valvular regurugitation: an executive summary from the EACI. Eur Heart J Cardiovasc Imaging 2013; 14:611-44
- MATSUMARA Y, FUKUDA S, TRAN H. Geometry of the proximal isovelocity surface area in mitral regurgitation by 3-dimensional color Doppler echocardiography: difference between functional mitral regurgitation and prolapse regurgitation. Am Heart J 2008; 155:231-8
- MINNERS J, ALLGEIER M, GOHLKE-BAERWOLF C, et al. Incosistent grading of aortic valve stenosis by current guidelines: haemodynamic studies in patients with apparently normal left ventricular function. Heart 2010; 96:1463-8
- NISHIMURA RA, CARABELLO BA. Operationalizing the 2014 ACC/AHA Guidelines for valvular heart disease. J Am Coll Cardiol 2016; 67:2289-94
- POH KK. Assessing aortic valve area in aortic stenosis by continuity equation: a novel approach using real-time three-dimensional echocardiography. Eur Heart J 2008; 29:2526-35.
- PU M, VANDERVOORT PM, GRIFFIN BP, et al. Quantification of mitral regurgitation by the proximal convergence method using transesophageal echocardiography. Clinical validation of a geometric correction for proximal flow constraint. Circulation 1995; 92:2169-77
- ROSSI A, DUJARDIN KS, BAILEY KR, et al. Rapid estimation of regurgitant volume by the proximal isovelocity surface area method in mitral regurgitation: Can continuous-wave Doppler echocardiography be omitted? J Am Soc Echocardiogr 1998; 11:138-48
- SIMPSON IA, SHIOTA T, GHARIB M, et al. Current status of flow convergence for clinical applications: Is it a leaning tower of "PISA" ? J Am Coll Cardiol 1996; 27:504-9
- TRIBOUILLOY C, SHEN WF, QUERE JP, et al. Assessment of severity of mitral regurgitation by measuring regurgitant jet width at its origin with transesophageal Doppler color flow imaging. Circulation 1992; 85:1248-53
- ZOGHBI WA, ADAMS D, BONOW RO, et al. Recommendations for noninvasive evaluation of native valvular regurgitation: a report from the ASE developed in collaboration with the SCMR. J Am Soc Echocardiogr 2017; 30:303-71


