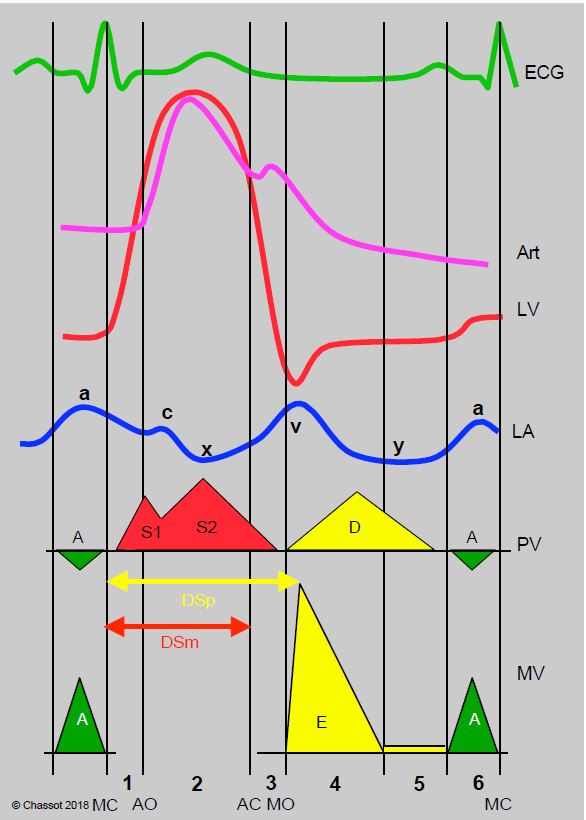
- a: Pressure wave due to atrial contraction at the end of diastole.
- x: diastolic pressure drop in the atrium that occurs during ventricular systole; this drop occurs in two stages, separated by the "c" drop. The first stage "x'" corresponds to atrial relaxation. The second "x''" is due to the descent of the mitral annulus during the longitudinal contraction of the left ventricle; this movement enlarges the atrium, whose pressure decreases.
- c: two phenomena are involved in this small increase in PLA: 1) bulging of the atrioventricular valve during the protosystole; 2) continuous filling by the central veins when the atrial wall has finished relaxing.
- v: as venous return continues during ventricular systole, the pressure in the atrium rises progressively until it is released into the ventricle at the start of diastole. The "v" wave therefore begins in telesystole and continues in protodiastole; its peak corresponds to the dicrotic of the arterial pressure and the peak velocity of the mitral flow E.
- y: pressure drop in the atrium as it empties into the ventricle in diastole.
- S: systolic component of the venous flow in the vena cava and the pulmonary vein; it is subdivided into phases S1 (atrial relaxation) and S2 (descent of the mitral annulus), corresponding to descent x' and x''. The flow S is a function of the pressure difference between the great veins and the atrium (mitral or tricuspid valve closed).
- D: diastolic component of venous and pulmonary venous flow. As the atrioventricular valve is open at this point, this flow is a function of the pressure difference between the great veins and the ventricle.
- A: Blood flow due to atrial contraction; this is anterograde through the tricuspid and mitral valves. As there are no valves in the vena cava or pulmonary veins, atrial contraction also produces a brief retrograde flow (Ar) in the large central veins.
- E: passive atrioventricular flow at the beginning of diastole; this normally represents 80% of ventricular filling. Its velocity is related to the level of atrial pressure and intraventricular depression in protodiastole (suction effect); the peak velocity of mitral flow (Vmax 0.8 - 1.0 m/s) corresponds to the peak of intraventricular dP/dt and the peak of the atrial "v" wave.
The flow velocities recorded by Doppler echocardiography are controlled by the instantaneous pressure gradient between the upstream and downstream cavities. The peak flow velocity corresponds to the maximum gradient. By convention, systole is considered to extend from isovolumetric contraction to closure of the aortic valve (phases 1-2) and diastole from isovolumetric relaxation to closure of the mitral valve (phases 3-4-5-6-7). However, the O2 consuming phase of the cardiac cycle, corresponding to myocardial systole, actually extends from isovolumetric contraction to the peak of protodiastolic intraventricular depression (peak Vmax of mitral flow E, maximum value of -dP/dt). Physiologically, therefore, systole extends to the peak of E-flow and diastole begins with the deceleration of this flow because protodiastolic relaxation is an active O2 consuming phenomenon corresponding to the persistence of contraction of the subepicardial oblique fibres (see Chapter 5, Diastolic Relaxation).
Figure 11.20: Wiggers diagram extended with filling currents. Art: systemic arterial curve. LV: Left ventricular pressure. LV: Left atrial pressure. PV: pulmonary venous flow. MV: flow through the mitral valve. 1: Isovolumetric ventricular contraction. 2: Ventricular ejection phase. 3: isovolumetric relaxation. 4: Rapid filling. 5: Diastasis. 6: Atrial contraction. AO: Opening of the aortic valve. AC: Aortic valve closing. MO: Opening of the mitral valve. MC: closing of the mitral valve. DSp: duration of physiological systole corresponding to the O2 consuming phases. DSm: duration of mechanical systole according to the conventional definition. The same synchronisation and variations in pressure and flow are found in the right cavities, but at lower pressures and velocities.
| Graphical representations |
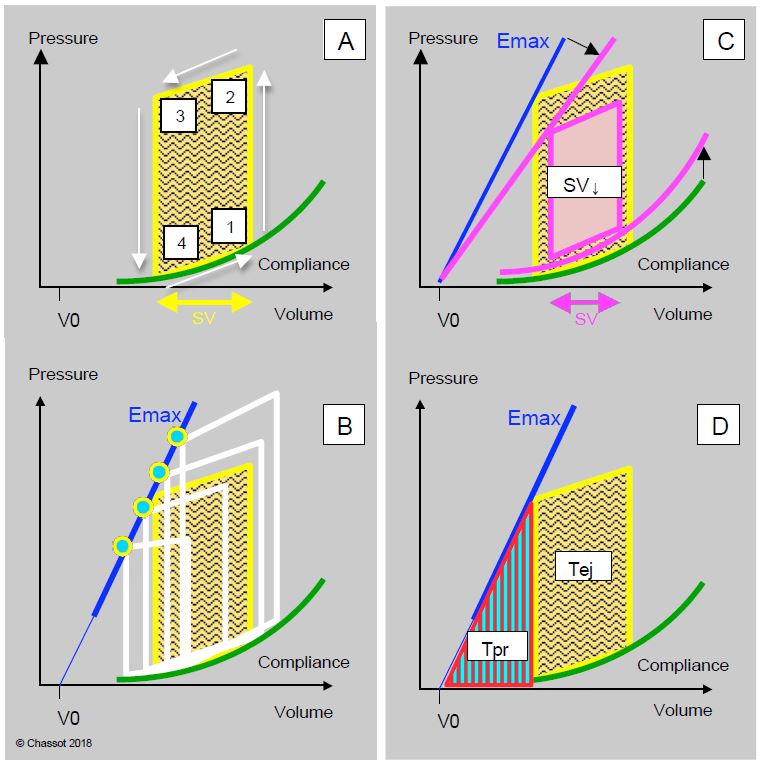
| The pressure-volume loop represents the evolution of a cardiac cycle; its area corresponds to the ejection work. Maximum elastance (Emax) is a quasi-straight line defined by the telesystolic points of the ventricle during variations in preload; its slope is an excellent index of contractility.
The synchronisation of flows and pressures shows that the peak flow corresponds to the peak of the upstream pressure and the trough of the downstream pressure. |
© CHASSOT PG, BETTEX D, August 2011, last update November 2019
References
- ASANOI H, SASAYAMA S, KAMEYAMA T. Ventriculoarterial coupling in normal and failing heart in humans. Circ Res 1989; 65:483-93
- SUNAGAWA K, SAGAWA K, MAUCHAN WL. Ventricular interaction with the vascular system in terms of pressure-volume relationships. In: YIN FCP, ed. Ventricular/vascular coupling. Clinical, physiological and engineering aspects. New York: Springer Verlag, 1987, 210-39.

