Two-dimensional echocardiography
Transthoracic echocardiography establishes the diagnosis and provides most of the information needed for surgery, but the transesophageal approach (TEE) undoubtedly provides a better definition of the lesions and mitral haemodynamics. This examination provides the most important data on mitral stenosis (MS) (see Figure 11.87) [4].
- Classic two-dimensional images:
- Dilatation of the LA, presence of spontaneous contrast (low flow) and thrombus in the LAA or in the body of the LA (less common).
Video: View of the left atrial appendage, with spontaneous contrast appearing as wisps of smoke.
-
- Reduced size of the LV, preserved function.
- AFR: commissural fusion of the two leaflets, limited leaflet motion, hockey stick deformation of the anterior leaflet in diastole, thickening and retraction of the subvalvular apparatus.
- Calcific degeneration: massive calcification of the ring and base of the leaflets, calcific deposits in the body of the leaflets but free ends.
- Dilatation and dysfunction of the RV, RVH, size of the RA, tricuspid regurgitation.
- Colour Doppler images: acceleration of diastolic flow through the mitral valve: zone of concentric acceleration on the atrial side (PISA: proximal isovelocity surface area), rapid flow through the valve (Vmax 1.5 - 2.5 m/s), turbulence on the ventricular side (Figure 11.92).
Video: Tight mitral stenosis with accelerated and swirling diastolic flow, preceded by a zone of concentric acceleration on the atrial side; the stenosis comes together with systolic regurgitation (mitral disease).
- Presence of associated MI.
- Look for aortic disease (polyvalvular rheumatic disease) and tricuspid regurgitation (usually due to right-sided overload and pulmonary hypertension).
- LV function: this is often impaired by inflammation (myocarditis in ARF) or by age and comorbidities (calcific degeneration). Diastolic insufficiency is responsible for an increase in PtdLA and PLA, which cannot be dissociated from the effects of mitral stenosis.
The Wilkins score assigns a certain number of points on a scale of 1 to 4 to four echocardiographic data: leaflet mobility, valve thickening, degree of calcification and remodelling of the subvalvular apparatus. The situation is considered favourable for balloon commissurotomy if the number of points is ≤ 8 out of a maximum of 16 [6].
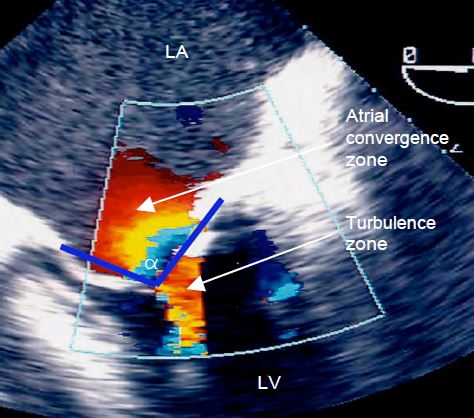
Figure 11.92: Colour Doppler flow in mitral stenosis. We see a zone of concentric diastolic acceleration on the atrial side of the valve (PISA - Proximal Isovelocity Surface Area) and vortex flow between the leaflets. The cone formed by the fused leaflets is defined by its angle α .
3D echocardiography
Two-dimensional measurements assume that the opening surface of the stenosis is parallel to the cross-sectional plane and that its pattern corresponds to the narrowest area. However, the valve is deformed like a cone that dips into the LV and there is no evidence that the section passes through the narrowest point. With 3D imaging, however, it is possible to perform planimetry at the narrowest point of the diastolic passage, regardless of its shape and orientation (see Figure 11.88). 3D planimetry provides the most reliable data on the mitral leaflet surface [3,7].
Video: seen in 3D from the LV, mitral stenosis appears as a cone plunging into the ventricle; its diastolic opening is merely a slit.
Pressure gradient
With the valve in front of the TEE transducer, the Doppler axis is well aligned with the mitral flow and allows accurate calculation of transvalvular pressure gradients in diastole (Figure 11.93) [2].
- The maximum flow velocity (Vmax) is used to calculate the maximum gradient using the simplified Bernouilli equation ΔP = 4 (Vmax)2 ; it is ≥ 20 mmHg in tight stenosis.
- The mean gradient ( ΔPmean), which is the average of the instantaneous gradients recorded over the duration of the flow, can be calculated from the spectral Doppler pattern of the mitral flow. It is 5-10 mmHg in moderate stenosis and ≥ 10 mmHg in severe stenosis. As it is less dependent on haemodynamic conditions, than ΔPmax, ΔPmean is a more reliable criterion for the degree of stenosis.
- Pressure gradients vary with tachycardia (short diastole) and cardiac output (low or high diastolic flow): low flow underestimates the degree of stenosis, as does diastolic dysfunction. In the case of atrial fibrillation, it is advisable to average 3-5 cardiac cycles, with a diastolic rate of 60-80 beats/min.
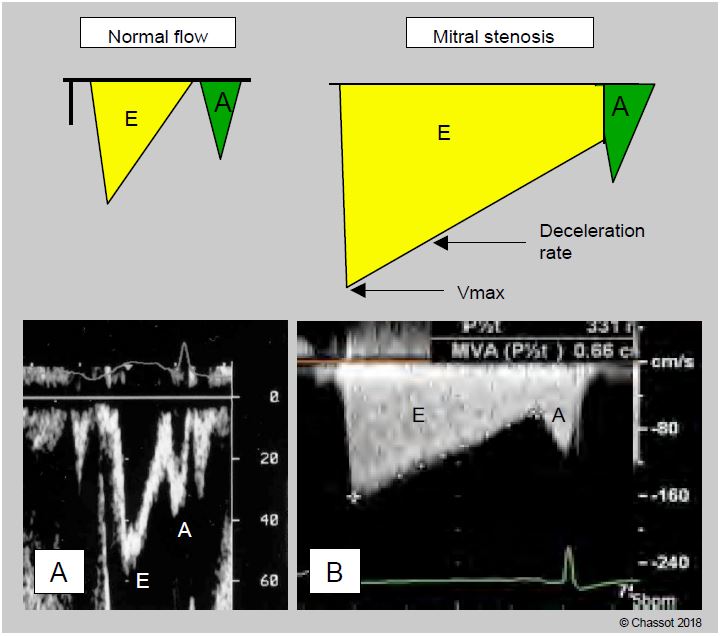
Figure 11.93: Illustration of mitral flow on transesophageal Doppler echocardiography. A: Normal flow. The E wave corresponds to passive protodiastolic flow, the A wave to atrial contraction flow. B: Flow in mitral stenosis. The maximum flow velocity (Vmax) is high, but the deceleration slope of the flow is very low because the emptying of the atrium into the ventricle is very slow; the pressure gradient changes slowly and remains high throughout diastole. The value of the deceleration slope of the E flow can be used to calculate the mitral surface area, since the smaller the surface area, the lower the value. In atrial fibrillation, the A wave disappears.
As the valve area does not change, an increase in cardiac output (exercise, pregnancy) or diastolic volume (hypervolemia, transfusion, associated MI) will geometrically increase the pressure gradient. As the stroke volume is reduced in MS, the pressure gradient of any associated aortic stenosis is reduced and the degree of stenosis is underestimated.
Opening area
The mitral valve orifice area in diastole can be measured by the deceleration slope of the E flow, by the continuity equation, by PISA or by 2D and 3D planimetry (see Chapter 26 Quantifying MS) [2].
As the flow through the mitral valve is very slow, the PLA remains high during diastole and the pressure gradient between the LA and LV decreases very slowly. As a result, the deceleration of the passive mitral flow (E flow) is very gradual and its slope is inversely proportional to the valve opening area. This slope is used to calculate the half-pressure time (Pt1/2 or pressure half-time PHT), i.e. the time taken for the pressure to fall by half (Dt) or for Vmax to fall to a velocity equal to the peak velocity divided by √2 (= 1.4), i.e. 0.71 Vmax. Since P is proportional to V2, Pt1/2 is equal to 0.29 Dt (Figure 11.94). In mitral stenosis, a Pt1/2 of 220 ms corresponds to an orifice area of 1 cm2 ; a higher value corresponds to an area < 1 cm2 . The area of mitral stenosis (MS) is equal to 220 divided by the measured Pt1/2: MS = 220 / Pt1/2 (cm2). The result is not valid in cases of aortic insufficiency due to simultaneous filling of the LV by the AI (shortening of the mitral flow and overestimation of the degree of stenosis); diastolic insufficiency has the same effect. As the echocardiographic machine calculates Pt1/2, the operator only needs to plot the mean slope of the E flow deceleration, avoiding the initial peak velocity if the slope is steeper there, and ignoring the A flow to extrapolate the straight line to the baseline [7].
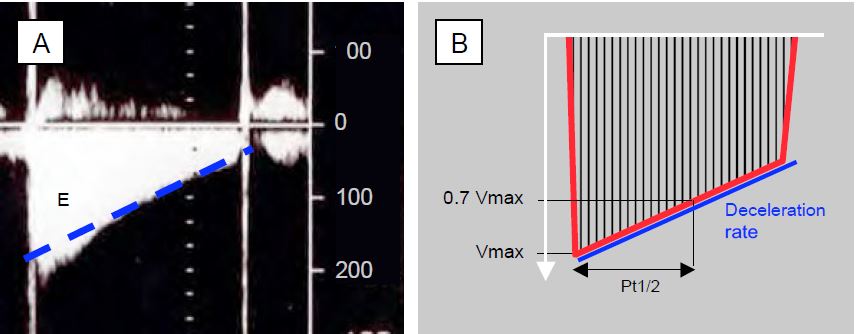
Figure 11.94: Quantification of mitral stenosis. A: Continuous Doppler diastolic mitral flow in a patient with atrial fibrillation (absence of atrial contraction A-flow); Vmax is 2 m/s; the deceleration slope of the E-flow is very slow because the ΔP between LA and LV decreases very slowly due to the narrowing of the mitral orifice. B: Calculation of the half-pressure time (Pt1/2) of the deceleration slope of the E flow; this is the time required for the pressure to fall by half. The calculation is made on the screen by plotting the straight line corresponding to the mean slope (blue dotted line in A), without taking into account the small accelerated stall at the beginning of the E flow.
The continuity equation states that the volume of blood flowing through the mitral valve (S · VTI) is equal to the volume of blood flowing through the LVOT, provided there is no shunt or insufficiency in the pathway. From this, the mitral valve (MV) area S can be derived: SMV = (SLVOT · VTILVOT)/VTIMV. The integral of velocities (VTI) in the LVOT is measured by pulsed Doppler a few millimetres in front of the aortic valve, where the diameter is measured to calculate the area, and that of the mitral valve by continuous Doppler across the stenosis. Because the two measurements cannot be made simultaneously, the relationship is distorted when stroke volume is variable, as in atrial fibrillation or mechanical ventilation.
Another application of the continuity equation is the PISA proximal isovelocity area. With a velocity scale fixed at 30-40 cm/s, the velocity of the first aliasing multiplied by the area of the corresponding hemisphere gives the volume of blood for the duration of diastole equal to that which crosses the mitral stenosis for the same duration. From this we deduce SMV = (2π r2 · Valias) / VMV. As the valve is generally funnel-shaped, the PISA is not hemispherical, but constricted by the angle α formed by the leaflets; hence: SMV = (2π r2 · Valias ) / VMV · α /180. This calculation does not depend on cardiac flow or output, so it remains valid in the case of associated MI. However, measuring the radius r of the first aliasing is often difficult because the plane of the orifice is difficult to define, and any error is squared in the calculation. In addition, the PISA technique assumes that the orifice is circular, which is rarely the case in these deformed valves, where it is more likely to be elliptical.
- Planimetry has the advantage of not being dependent on haemodynamics as Pt1/2 is. The measurement is made in meso-diastole and during a period of normal heart rate, because the opening is incomplete when diastole is shortened by tachycardia. However, it is difficult in two-dimensional imaging (Figure 11.95).
- Transgastric basal short-axis view 0-30°: This view is not feasible in all patients and is also unusable if the valve is heavily clacified. As the valve is conical, it is never certain that the two-dimensional slice actually measures the narrowest point; it may be in the middle of the cone and overestimate the size of the valve.
- Three-dimensional reconstruction (full volume): 3D imaging avoids this pitfall as it reconstructs all the leaflets and allows the measurement to be taken at the exact point that is the narrowest. 3D reconstruction is currently considered the gold standard for measuring the leaflet orifice in mitral stenosis.
- Using parametric remodelling algorithms, it is possible to extract the three-dimensional representation of the annulus and leaflets from a full-volume acquisition and measure the exact surface area of the leaflets, regardless of their shape. In this way, the maximum diastolic orifice of a mitral stenosis can be obtained without any geometric assumptions, since the area missing from the total leaflet area is equal to the area enclosed by the annulus. Compared to other techniques for measuring mitral area (continuity equation, PISA, Pt1/2), this method gives values that are about 30% lower; only 3D planimetry gives similar data [3].
The characteristics of a tight mitral stenosis are summarised in the diagram in Figure 11.96. It is important to base the diagnosis on a body of concordant evidence rather than a single piece of data.
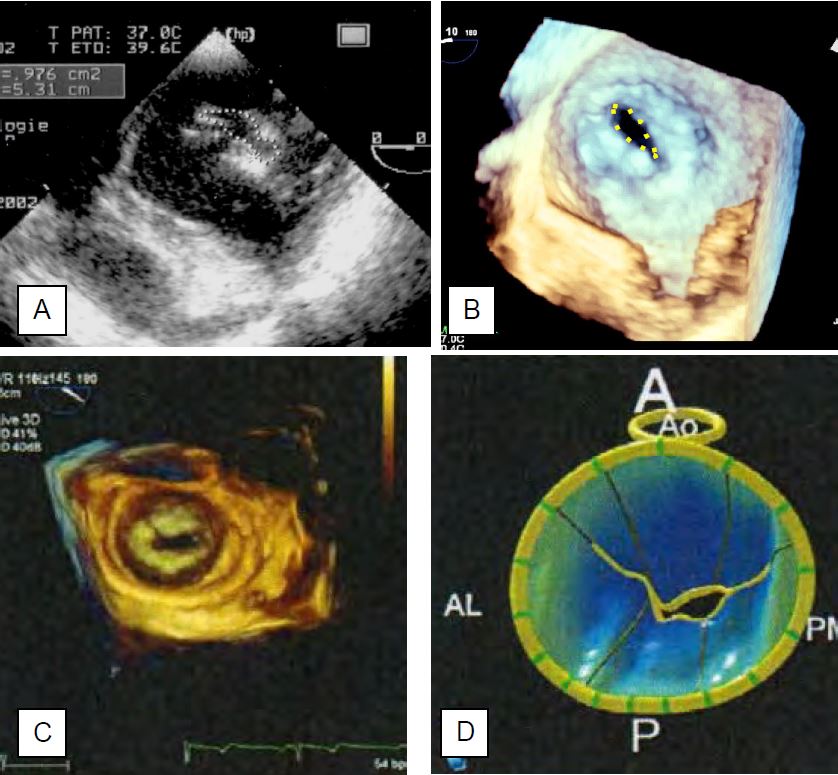
Figure 11.95: Planimetry of the orifice area of a narrow mitral stenosis. A: Two-dimensional short-axis 0° transgastric view; the measured area is 0.976 cm2. B: Three-dimensional view from the left ventricle. Because the valve is conical, there is never a guarantee that the two-dimensional slice actually measures the narrowest point; it may be in the middle of the cone and overestimate the size of the valve. 3D imaging avoids this pitfall by reconstructing all the leaflets and allowing the measurement to be taken at the exact narrowest point. D: Parametric reconstruction of the mitral annulus and leaflets from a full volume image (C) in the presence of stenosis. Diastolic images showing the small opening of the valve; the areas in blue are below the plane of the annulus. 3D reconstruction is currently considered the standard measure of valve orifice area in mitral stenosis [from: Poelaert JI, Bouchez S. Perioperative echocardiographic assessment of mitral valve regurgitation: a comprehensive review. Eur J Cardio-Thor Surg 2016; 50:801-12].
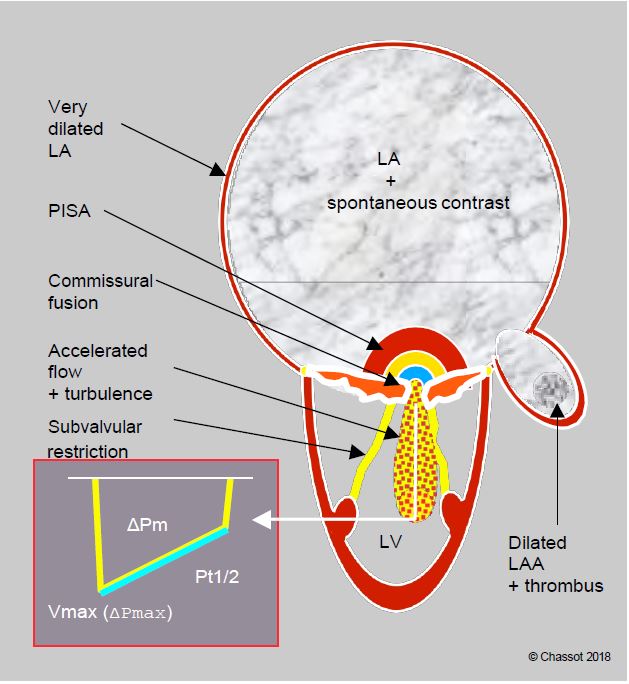
Figure 11.96: Schematic summary of the echocardiographic features of severe mitral stenosis. The silhouette is characteristic: huge LA with spontaneous contrast, dilated left atrial appendage (LAA), often containing a thrombus in AF, small LV, deformed and restrictive mitral leaflets with commissural fusion, restrictive, thickened and shortened subvalvular apparatus. On Doppler, zone of concentric acceleration on the atrial side (PISA) in diastole, accelerated transmitral flow (Vmax 2 m/s) and intraventricular vortex zone, high mean gradient (≥ 12 mmHg), half-pressure time (Pt1/2) > 220 ms.
Catheterisation
Catheterisation is only indicated if the echocardiographic findings are equivocal or discordant, including after stress echocardiography [5]. It is unnecessary if the echocardiography is clear and consistent with the clinical symptoms. Coronary angiography is indicated if coronary artery disease is suspected; it is recommended from the age of 45 in men and 50 in women if bypass surgery is being considered [1]. Right heart catheterisation may be required in patients with severe COPD or pulmonary hypertension.
| Echocardiography in severe mitral stenosis |
|
Characteristic two-dimensional silhouette: - Large LA with spontaneous contrast, small LV - Dilated left atrial appendage (LAA), often harbouring a thrombus in AF Colour Doppler: |
© CHASSOT PG, BETTEX D, August 2011, last update November 2019
References
- BRAUNWALD E. Valvular heart disease. In: BRAUNWALD E. ed. Heart disease. Philadelphia, WB Saunders Co, 1997, 1007-76
- CHERRY AD, MAXWELL CD, NICOARA A. Intraoperative evaluation of mitral stenosis by transesophageal echocardiography. Anesth Analg 2016; 123:14-20
- KARAMNOV S, BURBANO-VERA N, HUANG CC, et al. Echocardiographic assessment of mitral stenosis orifice area: a comparison of a novel three-dimensional method versus conventional techniques. Anesth Anlg 2017; 125:774-80
- MICHELENA HI, ABEL MD, SURI RM, et al. Intraoperative echocardiography in valvular heart disease: An evidence-based appraisal. Mayo Clin Proc 2010; 85:646-55
- NISHIMURA RA, OTTO CM, BONOW RO, et al. 2014 AHA/ACC Guideline for the management of patients with valvular heart disease. Circulation 2014; 129:e521-e643
- WILKINS GT, WEYMAN AF, ABASCAL VM, et al. Percutaneous balloon dilatation of the mitral valve: en analysis of echocardiographic variables related to outcome and the mechanism dilatation. Br Heart J 1988; 60:299307
- WUNDERLICH NC, BEIGEL R, SIEGEL RJ. Management of mitral stenosis using 2D and 3D echo-Doppler imaging. JACC Cardiovasc Imaging 2013; 61:1191-205